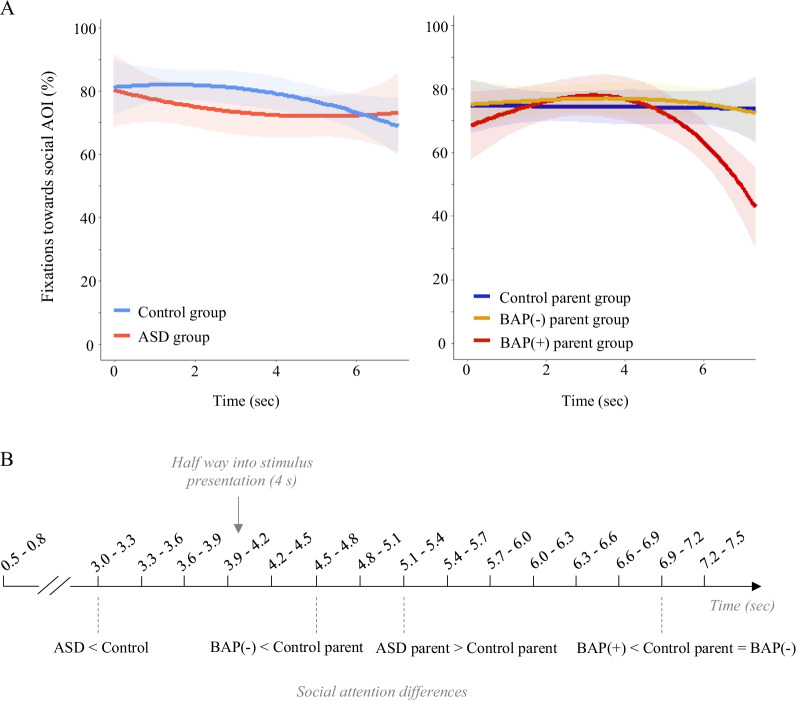
Fig. 4.
Dwell time patterns depicting A proportion of fixations over time (higher value indicates greater social attention) and B a schematic representing divergence time-bin analyses, where individuals with ASD were observed to attend less to social information than the control group half way into the stimulus presentation. Both BAP(−) and BAP(+) parents showed a spike in social attention around 5 s, with the BAP(+) group showing a striking decrease in social attention towards the end of the stimulus presentation compared to BAP(−) and Control parent groups

