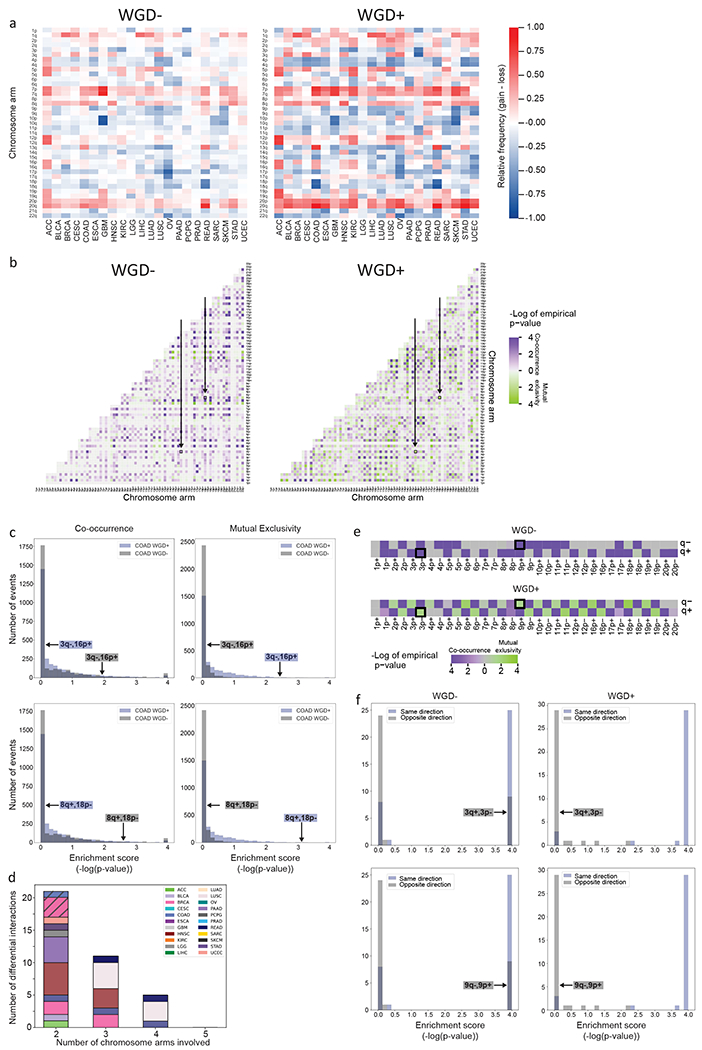
Figure 2: WGD is associated with significant changes in aneuploidy prevalence patterns.

(a) Heatmaps of the relative prevalence of all chromosome-arm gains and losses in WGD− tumors (left) and WGD+ tumors (right), across 22 tumor types. The prevalence of the events was calculated by GISTIC 2.0. (b) Heatmaps of the significance (−log(empirical p-value)) of positive genetic interactions (co-occurrence, purple) and negative genetic interactions (mutual exclusivity, green) between chromosome arms of different chromosomes in WGD− tumors (left) and WGD+ tumors (right) of colon adenocarcinomas (COAD). Note the interactions between loss of chromosome 3q (3q−) and gain of chromosome 16p (16p+), and between gain of chromosome 8q (8q+) and loss of chromosome 18p (18p−), which are significantly co-occurring in WGD− tumors and significantly mutually exclusive in WGD+ tumors (empirical p<0.05; q<0.25) and are highlighted on the heatmaps. (c) Histograms of the distribution of enrichment scores (defined as −log(empirical p-value)) for co-occurrence (left) and mutual exclusivity (right) of inter-chromosomal genetic interactions in WGD− vs. WGD+ COAD tumors. The discordant genetic interactions (3q−,16p+; 8q+,18p−) are highlighted on the histograms. (d) Bar plot presenting the number of differential interactions between WGD− and WGD+ tumors, for n=2, n=3, n=4 and n=5 chromosome arms (using the SuperExactTest algorithm). Samples are colored by tumor type. For n=2, interactions that were also identified as differential in the permutation analysis are denoted by diagonal lines. For n=3, n=4 and n=5, shown are genetic interactions found to be more significant than any of the subset interactions that comprise them. (e) Heatmaps of the significance (−log(empirical p-value)) of positive genetic interactions (co-occurrence, purple) and negative genetic interactions (mutual exclusivity, green) between gains and losses of chromosome arms within the same chromosome in WGD− tumors (top) and WGD+ tumors (bottom) of COAD. Note the interactions between loss of chromosome 3p (3p−) and gain of chromosome 3q (3q+), and between gain of chromosome 9p (9p+) and loss of chromosome 9q (9q−), which are significantly co-occurring in WGD− tumors and significantly mutually exclusive in WGD+ tumors (empirical p<0.05; q<0.25) and are highlighted on the heatmaps. (f) Histograms of the distribution of enrichment scores (defined as −log(empirical p-value)) for co-occurrence of same-direction and opposite-direction intra-chromosomal genetic interactions in WGD− (left) and WGD+ (right) COAD tumors. The discordant genetic interactions, which are co-occurring in one WGD group and mutually exclusive in the other (3p−,3q+; 9p+,9q−), are highlighted on the histograms. Tumor type abbreviations as in Fig. 1.
