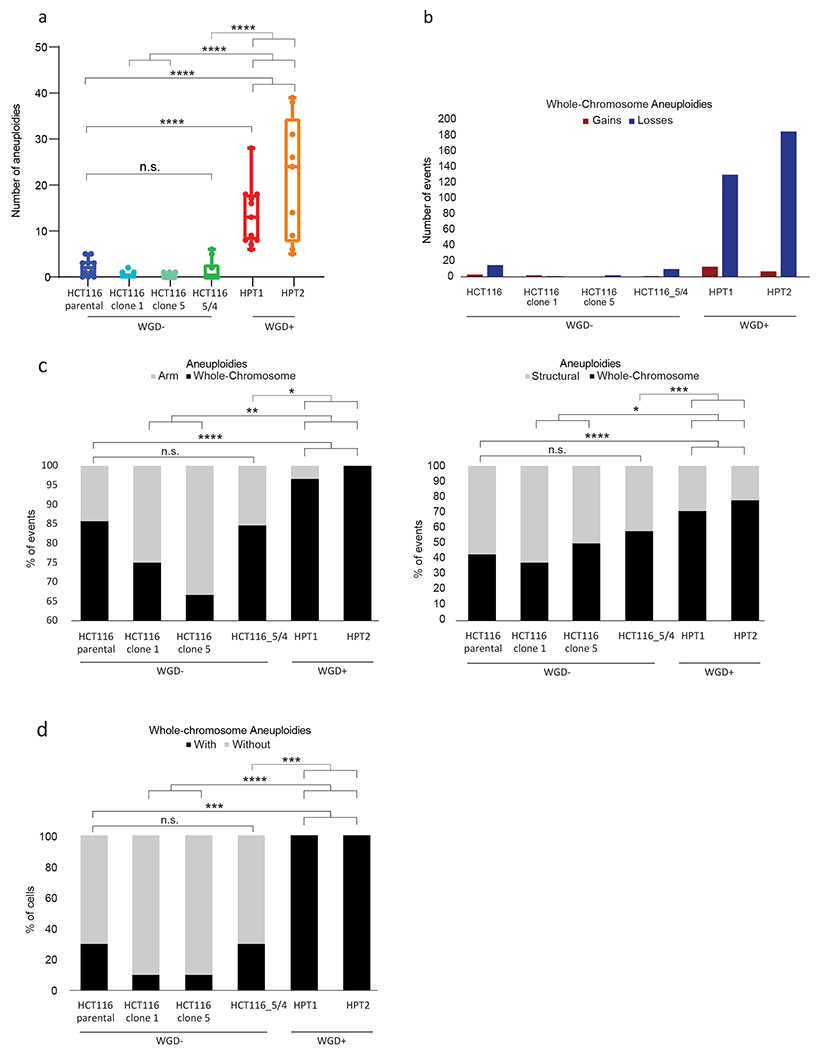
Figure 4: Isogenic WGD− and WGD+ HCT116 cell lines demonstrate a causal effect of WGD on aneuploidy landscapes.

(a) mFISH-based comparison of the number of aneuploidies (relative to basal ploidy) between the near-diploid parental HCT116 cells (HCT116-WT), two WGD− HCT116 clones (#1 and #5), HCT116 cells with two extra copies of chromosome 5 introduced through microcell-mediated chromosome transfer (HCT116–5/4) (42), and two WGD+ HCT116 clones (HPT1 and HPT2) (7). n.s., p>0.05, ***, p<0.001; ****, p<0.0001; two-tailed Student’s t-test. (b) The number of whole-chromosome gains and losses observed by mFISH, in HCT116 and its derived clones (>10 single cells per clone). (c) The relative fraction of whole-chromosome aneuploidies relative to arm-level aneuploidies (left) or structural aneuploidies (right; including arm-level aneuploidies, translocations and smaller structural alterations), in HCT116 and its derived clones. n.s., p>0.05, **, p<0.01, ***, p<0.001; ****, p<0.0001; one-tailed Fisher’s Exact test. (d) The fraction of cells with non-clonal whole-chromosome aneuploidies, a measure of karyotypic heterogeneity, in HCT116 and its derived clones. ***, p<0.001; one-tailed Fisher’s Exact test.
