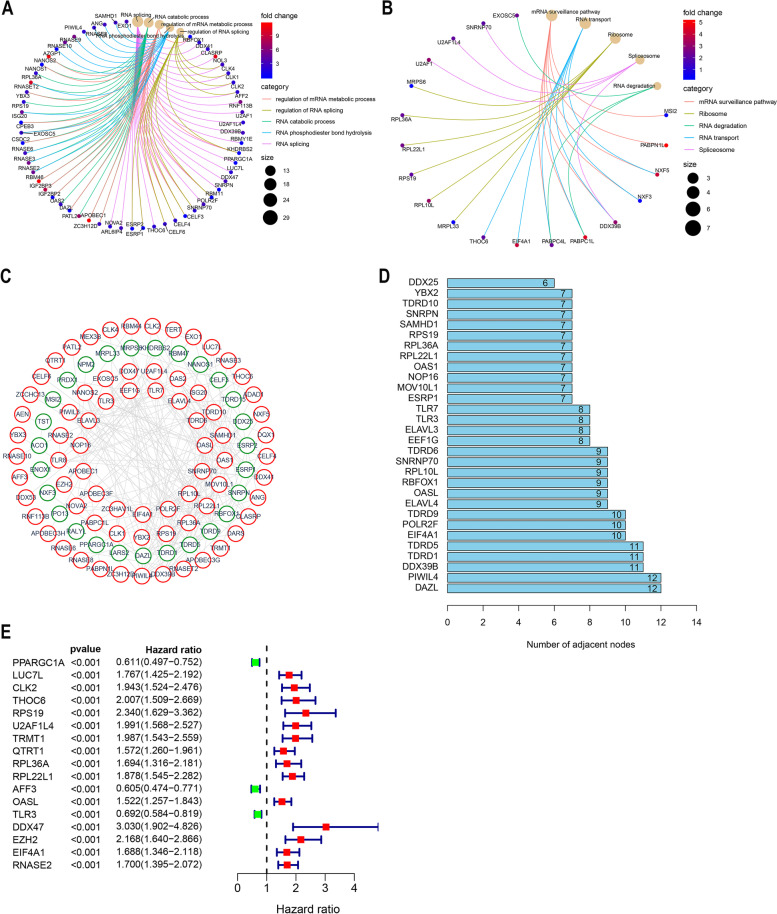
Fig. 3.
Bioenrichment analysis of differential expression RBPs. A-B Gene Ontology (GO) and Kyoto Encyclopedia of Genes and Genomes (KEGG) enrichment analysis, screening criteria as p < 0.05, q < 0.05 (Adjusted p value). DERBPs are enriched for relevant biological co-energies and associated molecular signalling pathways (BP:biological process CC: cell component MF: molecular function). C DERBPs protein–protein interaction network. The connections in the network represent interactions among genes, with green representing down-regulated genes and red up-regulated genes (Confidence = 0.7). D Number of node connections in a PPI network. The connections of the first 30 genes are displayed by the number of node connections. E RBPs associated with survival were screened by univariate Cox regression analysis (p < 0.0001)

