. 2019 Aug 8;9(42):24568–24594. doi: 10.1039/c9ra03562a

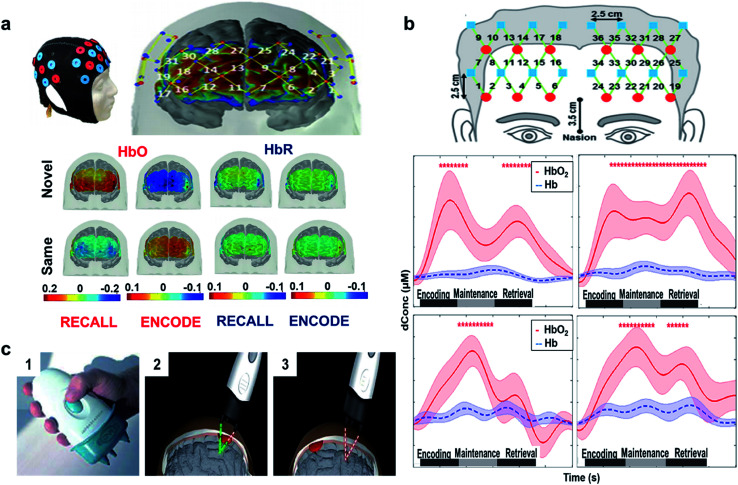
Fig. 5. (a) fNIRS designed probe. Location of sources (red circles) and detectors (blue circles) on the cap (top left). Sensitivity profile for the probe. The channel numbers are in yellow. The color scale spans the sensitivity logarithmically from 0.01 (blue) to 1 (red). Group mean HbO and HbR hemodynamic responses overlayed over the brain surface for: encoding (bottom left) and recalling (bottom right) of novel and same faces. The displayed concentration changed was averaged from t = 25 to 50 s. The color bar indicates the scale of the concentration change in μM units. Reproduced with permission from ref. 101. Copyright 2017, Nature Publishing Group. (b) Configuration (top) of the fNIRS probe. Red circles represent light sources, blue squares represent detectors, and green lines represent the nearest source–detector pairs (channels) to measure the brain activities. Mean task-evoked prefrontal hemodynamic responses in the: control group (middle) forward task (middle left) and backward task (middle right), PTSD group (bottom) forward task (bottom left) and backward task (bottom right). In both panels, the solid lines represent the mean time courses of HbO2, the dotted lines represent the mean time courses of Hb, the shaded regions represent the standard errors, the * symbols indicate the period of significant HbO2 changes (one-sample t-test, p < 0.01) from the baseline, and the gray bars in the bottom indicate the three phases of the task. It is noted that the actual retrieval time was slightly variable among participants. Therefore, the retrieval phases labeled in both panels are schematic and approximate. Reproduced with permission from ref. 104. Copyright 2014, Tian et al. Published by Elsevier. (c) Handheld NIR device. Bluetooth equipped Full device (part 1) intra (part 2) and extra (part 3) – axial hemorrhagic haematomas acquisition. Reproduced with permission from ref. 105. Copyright 2010, Taylor & Francis.

Fig. 5