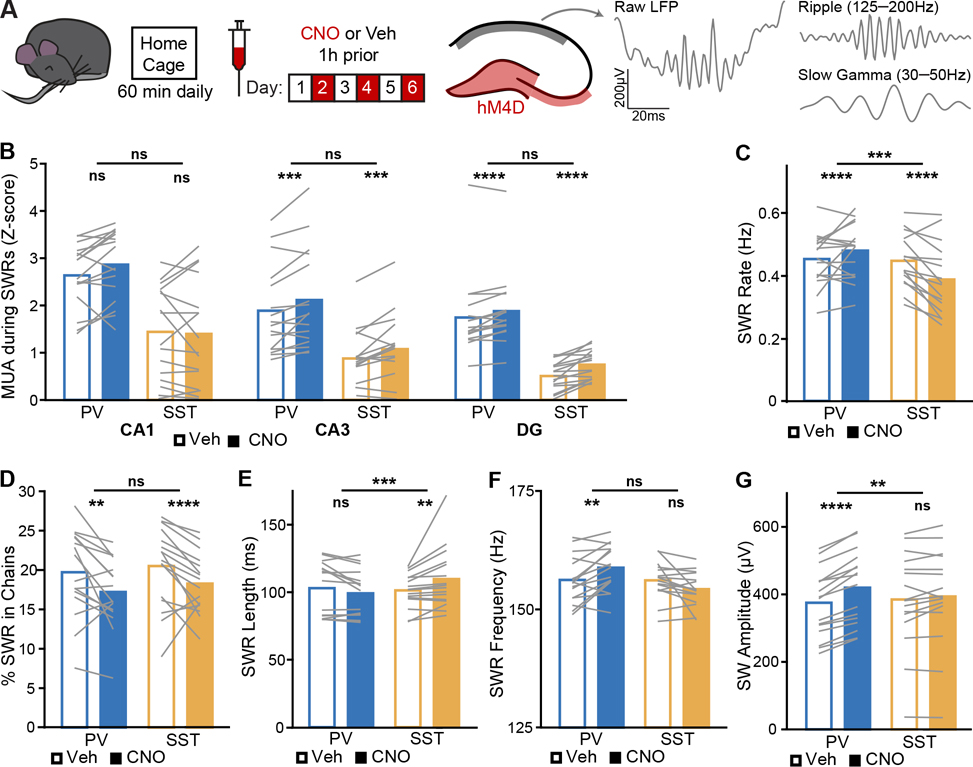
Figure 3. Suppressing PV+ or SST+ interneurons bidirectionally modulates SWR signatures of CA3 coupling to CA1.
(A) Mice were recorded during sleep and awake rest over 6 daily home cage sessions, alternating vehicle and CNO treatment. Interneurons in DG and CA3 (magenta) were inhibited while SWRs and related oscillations were assessed in CA1 stratum pyramidale (pyr) and stratum radiatum (sr) (grey). Representative raw, ripple filtered, and SG filtered traces of a SWR event from a CA1-pyr site of a PV-Cre/SST-Cre mouse during vehicle treatment.
(B) Normalized recruitment to SWRs of MUA in CA1 (PV: p = 0.13; SST: p = 0.46; PV vs SST: p = 0.023), CA3 (PV: p = 0.00075; SST: p = 0.00076; PV vs SST: p = 0.095), and DG (PV: p = 5.5×10⁻⁶; SST: p = 3.4×10⁻⁵; PV vs SST: p = 0.059).
(C) SWR rate (PV: p = 1.9×10⁻⁶; SST: p = 4.6×10⁻⁵; PV vs SST: p = 0.00098).
(D) Percent of SWRs following another SWR within 200 ms (PV: p = 0.001; SST: p = 2.5×10⁻⁵; PV vs SST: p = 0.99).
(E) SWR temporal length (PV: p = 0.033; SST: p = 0.0023; PV vs SST: p = 0.00034).
(F) SWR instantaneous frequency (PV: p = 0.0012; SST: p = 0.033; PV vs SST: p = 0.018).
(G) SW amplitude (PV: p = 6.4×10⁻²⁷; SST: p = 0.25; PV vs SST: p = 0.005).
N = 16 PV-Cre and n = 16 SST-Cre mice. Statistical details in Table S3. F test of the LMM for treatment effects, likelihood ratio test for genotype-treatment interaction effects. **p < 0.01; ***p < 0.001; ****p < 0.0001. Central values are means and individual points are mean per animal. See also Figures S2, S3, S6, and S7 and Tables S2–S7.

