. 2022 Feb 23;28(9):1938–1947. doi: 10.1158/1078-0432.CCR-21-2585

Figure 1.

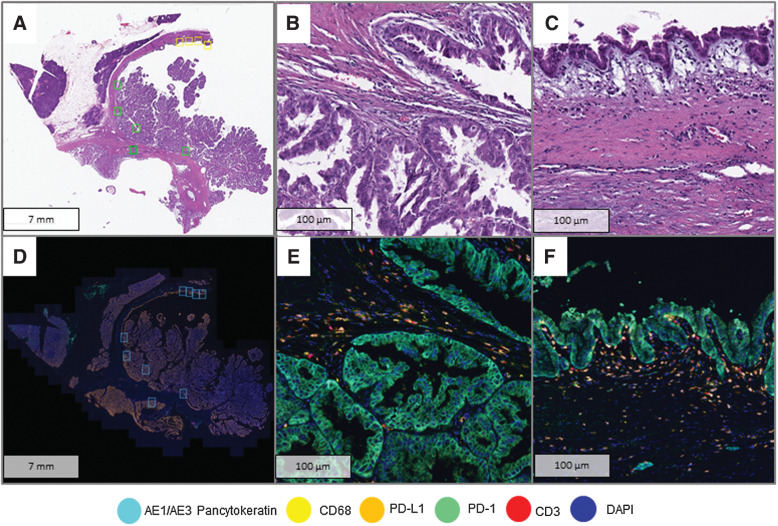
Figure 1. Analysis of immune cell infiltrates using mIF. A, Whole section H&E slide of a high-grade IPMN with HGD areas (yellow squares) and LGD areas (green squares) selected for digital image analysis. B, HGD area at high resolution (40×). C. LGD area at high resolution (40×). D, Image scan of Phenochart with selected areas for high magnification (blue squares). E, Panel 1 composite of HGD area (40×). F, Panel 1 composite of LGD area.

Analysis of immune cell infiltrates using mIF. A, Whole-section H&E slide of a high-grade IPMN with HGD areas (yellow squares) and LGD areas (green squares) selected for digital image analysis. B, HGD area at high resolution (40×). C. LGD area at high resolution (40×). D, Image scan of Phenochart with selected areas for high magnification (blue squares). E, Panel 1 composite of HGD area (40×). F, Panel 1 composite of LGD area.