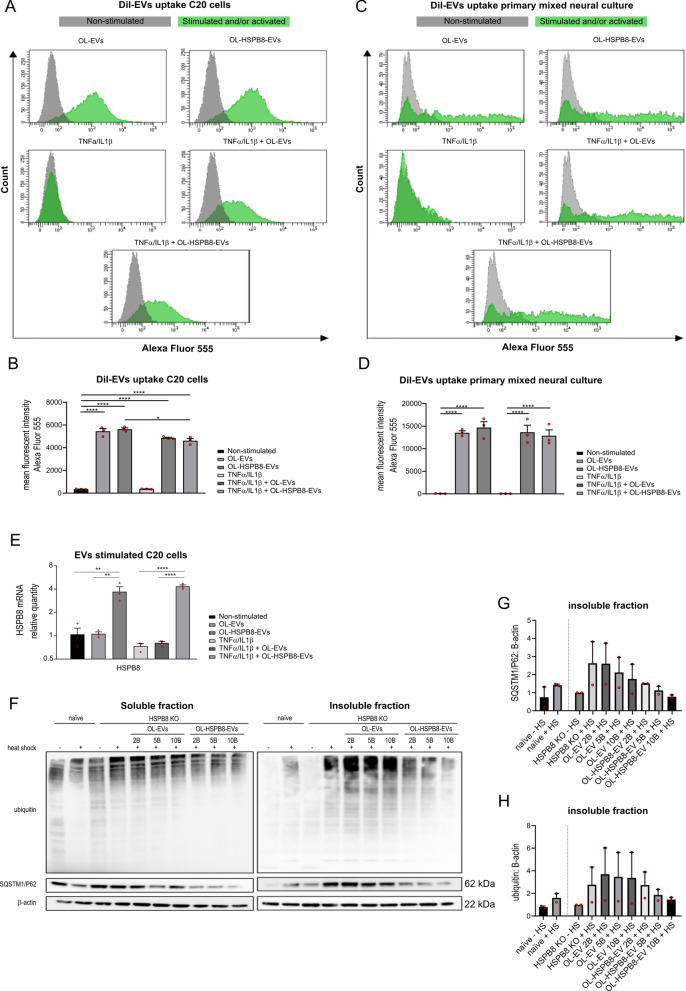
Fig. 2.
OL-EVs and OL-HSPB8-EVs uptake and chaperone activity. A–D Quantification of cellular uptake of DiI-labelled OL-EVs and OL-HSPB8-EVs by flow cytometry in human microglia C20 and primary mixed neural cultures. The data presents the mean fluorescent intensity and are shown as mean ± SEM (n = 3 biological replicates per group. Green peaks show live cells stimulated with DiI-labelled EVs and/or activated with TNFα/IL1β while grey peaks show the non-stimulated, non-activated live cells E Relative qPCR expression of HSPB8 in human microglia C20 cell line stimulated with OL-EVs or OL-HSPB8-EVs either non-activated or TNFα/IL1β activated. Data were analyzed using stable reference genes, and the fold changes were plotted as the mean ± SEM and normalized to the non-stimulated control cells (n = 3 biological replicates per group). F–H Western blotting analysis of SQSTM1/P62 and ubiquitinated proteins in HeLa HSPB8-KO cells in the soluble (non-aggregated) and insoluble fraction (aggregated). The cells were either OL-EVs, OL-HSPB8-EVs stimulated or non-stimulated and exposed to a 90 min heat shock at 42 °C. Protein levels were calculated from two independent experiments and normalized to β-actin. Band intensities were determined by quantifying the mean pixel gray values using the ImageJ software. Data are presented as mean ± SEM. One-way ANOVA was used in GraphPad to determine statistical significance (*P < 0.05, **P < 0.01, ***P < 0.001, ****P < 0.0001)

