Fig. 3.
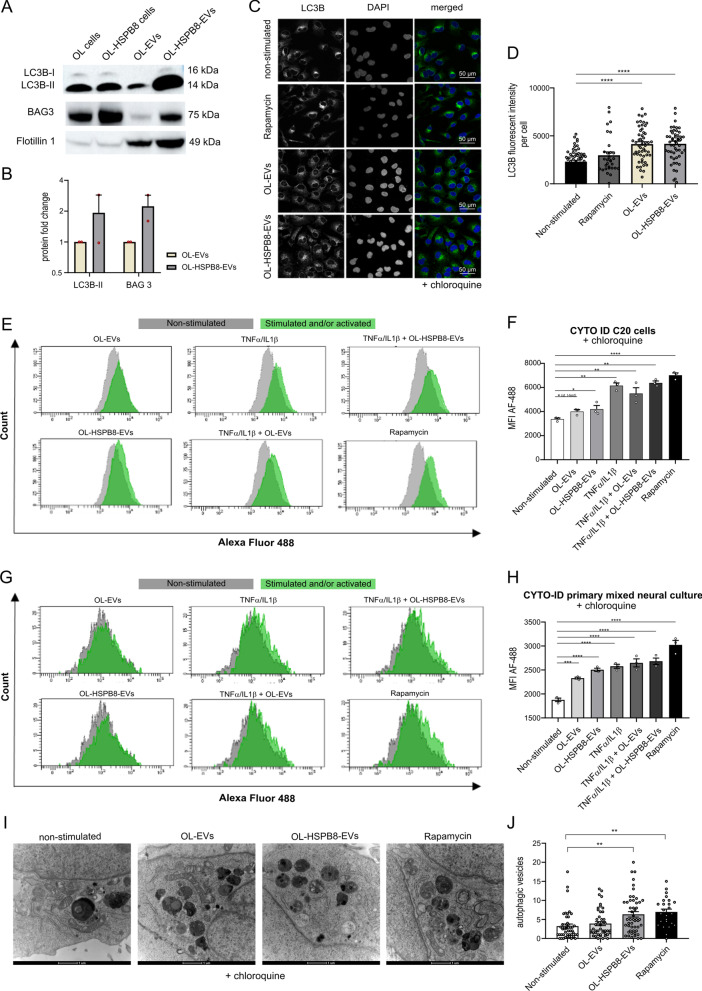
OL-EVs and OL-HSPB8-EVs stimulation activate autophagy in human microglia and primary mixed neural cells. A, B Western blotting analysis of LC3B-II and BAG3 in OL-EVs and OL-HSPB8-EVs. Protein levels were calculated from two independent experiments and normalized to the EVs marker flotillin-1. Band intensities were determined by quantifying the mean pixel gray values using the ImageJ software. Data are presented as mean ± SEM. C, D Immunofluorescence staining of human microglial C20 cells stimulated with OL-EVs or OL-HSPB8-EVs. Cells were treated with chloroquine to inhibit lysosomal degradation. Rapamycin was used as a positive control. Representative image showing LC3B (green), the DAPI nucleus stain (blue), and merged images. CellProfiler was used to quantify the LC3B punctate structures (LC3B, mean fluorescence intensity) (n = 4 biological replicates, 15 + cells per experiment). Data are expressed as mean ± SEM, ****P < 0.0001. E–H Flow cytometry monitoring CYTO-ID autophagic flux in chloroquine treated human microglia C20 cell line and a primary mixed neural culture using the CYTO-ID green detection dye, selectively labeling autophagic vacuoles. Data are presented as mean fluorescent intensities ± SEM (n = 3 biological replicates per group), Green peaks represent TNFα/IL1β activated and/or EV stimulated cells, while the grey peaks show cells of non-activated and non-stimulated control cells. GraphPad was used to determine significance (*P < 0.05, **P < 0.01, ***P < 0.001, ****P < 0.0001). I, J Ultrastructural analysis of autophagic vesicles by transmission electron microscopy of C20 cells stimulated with OL-EVs or OL-HSPB8-EVs. Lysosomal degradation was blocked using chloroquine. Rapamycin was used as a positive control. The total number of autophagic vesicles per field of view were counted and expressed per cytoplasmic area covered (scale bar = 1 µm). Data are shown as mean ± SEM. GraphPad was used for statistical analysis by using one-way ANOVA (**P < 0.01)

