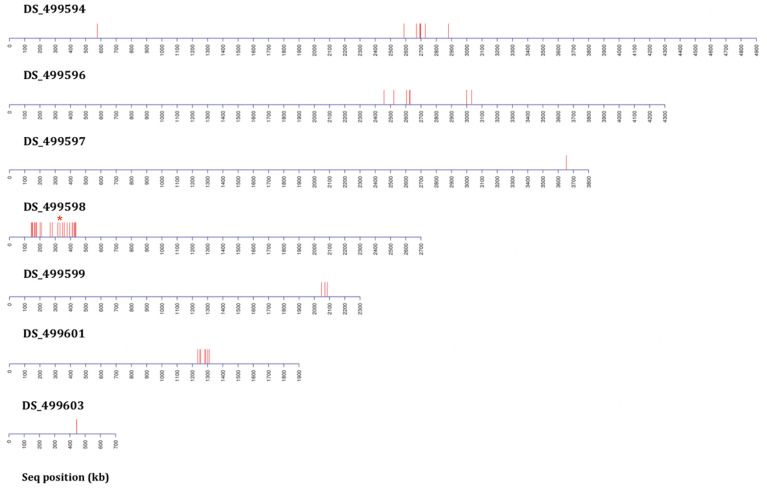
Figure 4.
Distribution plots of SNP variants identified from bioinformatic analysis mapped onto A. fumigatus JGI reference A1163 genome contigs (not to scale) from bulk segregant analysis (BSA) applied following two rounds of backcrossing (BC2) using 80 progeny per BSA pool. Each red bar represents one or more (if in close proximity) variant sites exhibiting a consistent difference between the sensitive and resistant groupings. Data includes sites present in gene coding and non-coding regions. The red asterisk above contig DS_499598 indicates the position of the M220K causal variant in cyp51A.

