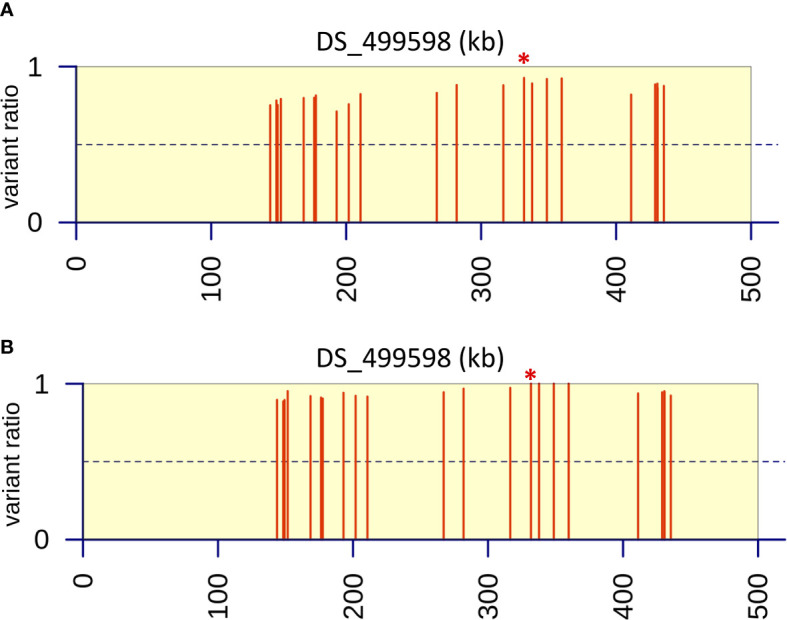
Figure 5.

Variant ratio plots to show extent of heterozygosity or homozygosity at SNPs identified on contig DS_499598 from bioinformatic analysis. (A) Data analysis of resistant parent and progeny pool (n=40) derived after six back crosses (BC6). (B) Data analysis of resistant parent and progeny pool (n=80) derived after two back crosses (BC2). Values were calculated as the ratio of the average coverage supporting that variant compared to the average total coverage at that given position across the three replicates in the progeny pools. The red asterisk indicates the position of the M220K causal variant in cyp51A.
