. 2019 Aug 19;9(44):25861–25874. doi: 10.1039/c9ra04430b

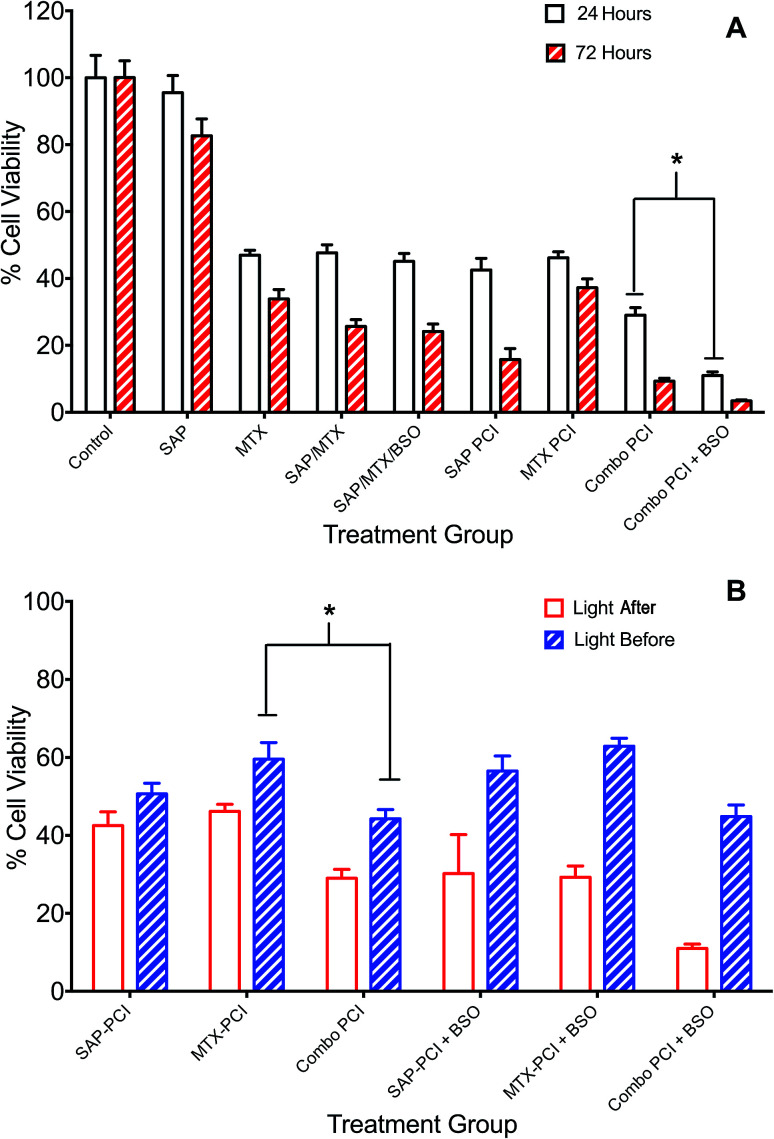
Fig. 4. Combination PCI treatment studies. 4T1 breast cancer cells were incubated with different combinations of TPPS2a 0.6 μg ml−1, SAP 15 nM, MTX 0.4 μg ml−1 and BSO 1.0 μg ml−1. To administer PCI, cells were illuminated for 120 s, according to the light “before” or light “after” protocol with cell viability measured using MTT assay 24 h or 72 h after illumination. (A) Cells were treated with photosensitiser or SAP or MTX alone or in various combinations ± BSO and illuminated for 120 s using the light ‘after’ protocol; MTT viability study performed 24 h (white histogram) or 72 h (red striped) after illumination; (B) SAP and/or MTX was added to the appropriate treatment groups either preceding (light ‘after’) or following (light ‘before’) illumination. There were significant statistical differences between all 24 h and 72 h treatments (4A) and all (apart from APS-PCI) light ‘before’ and light ‘after’ groups, which are not designated on the graphs, to avoid cluttering. Also note that the control values for PDT and BSO only with/without light that are shown in Fig. 3 also apply to this figure but are omitted for the sake of clarity (* designates P < 0.01).

Fig. 4