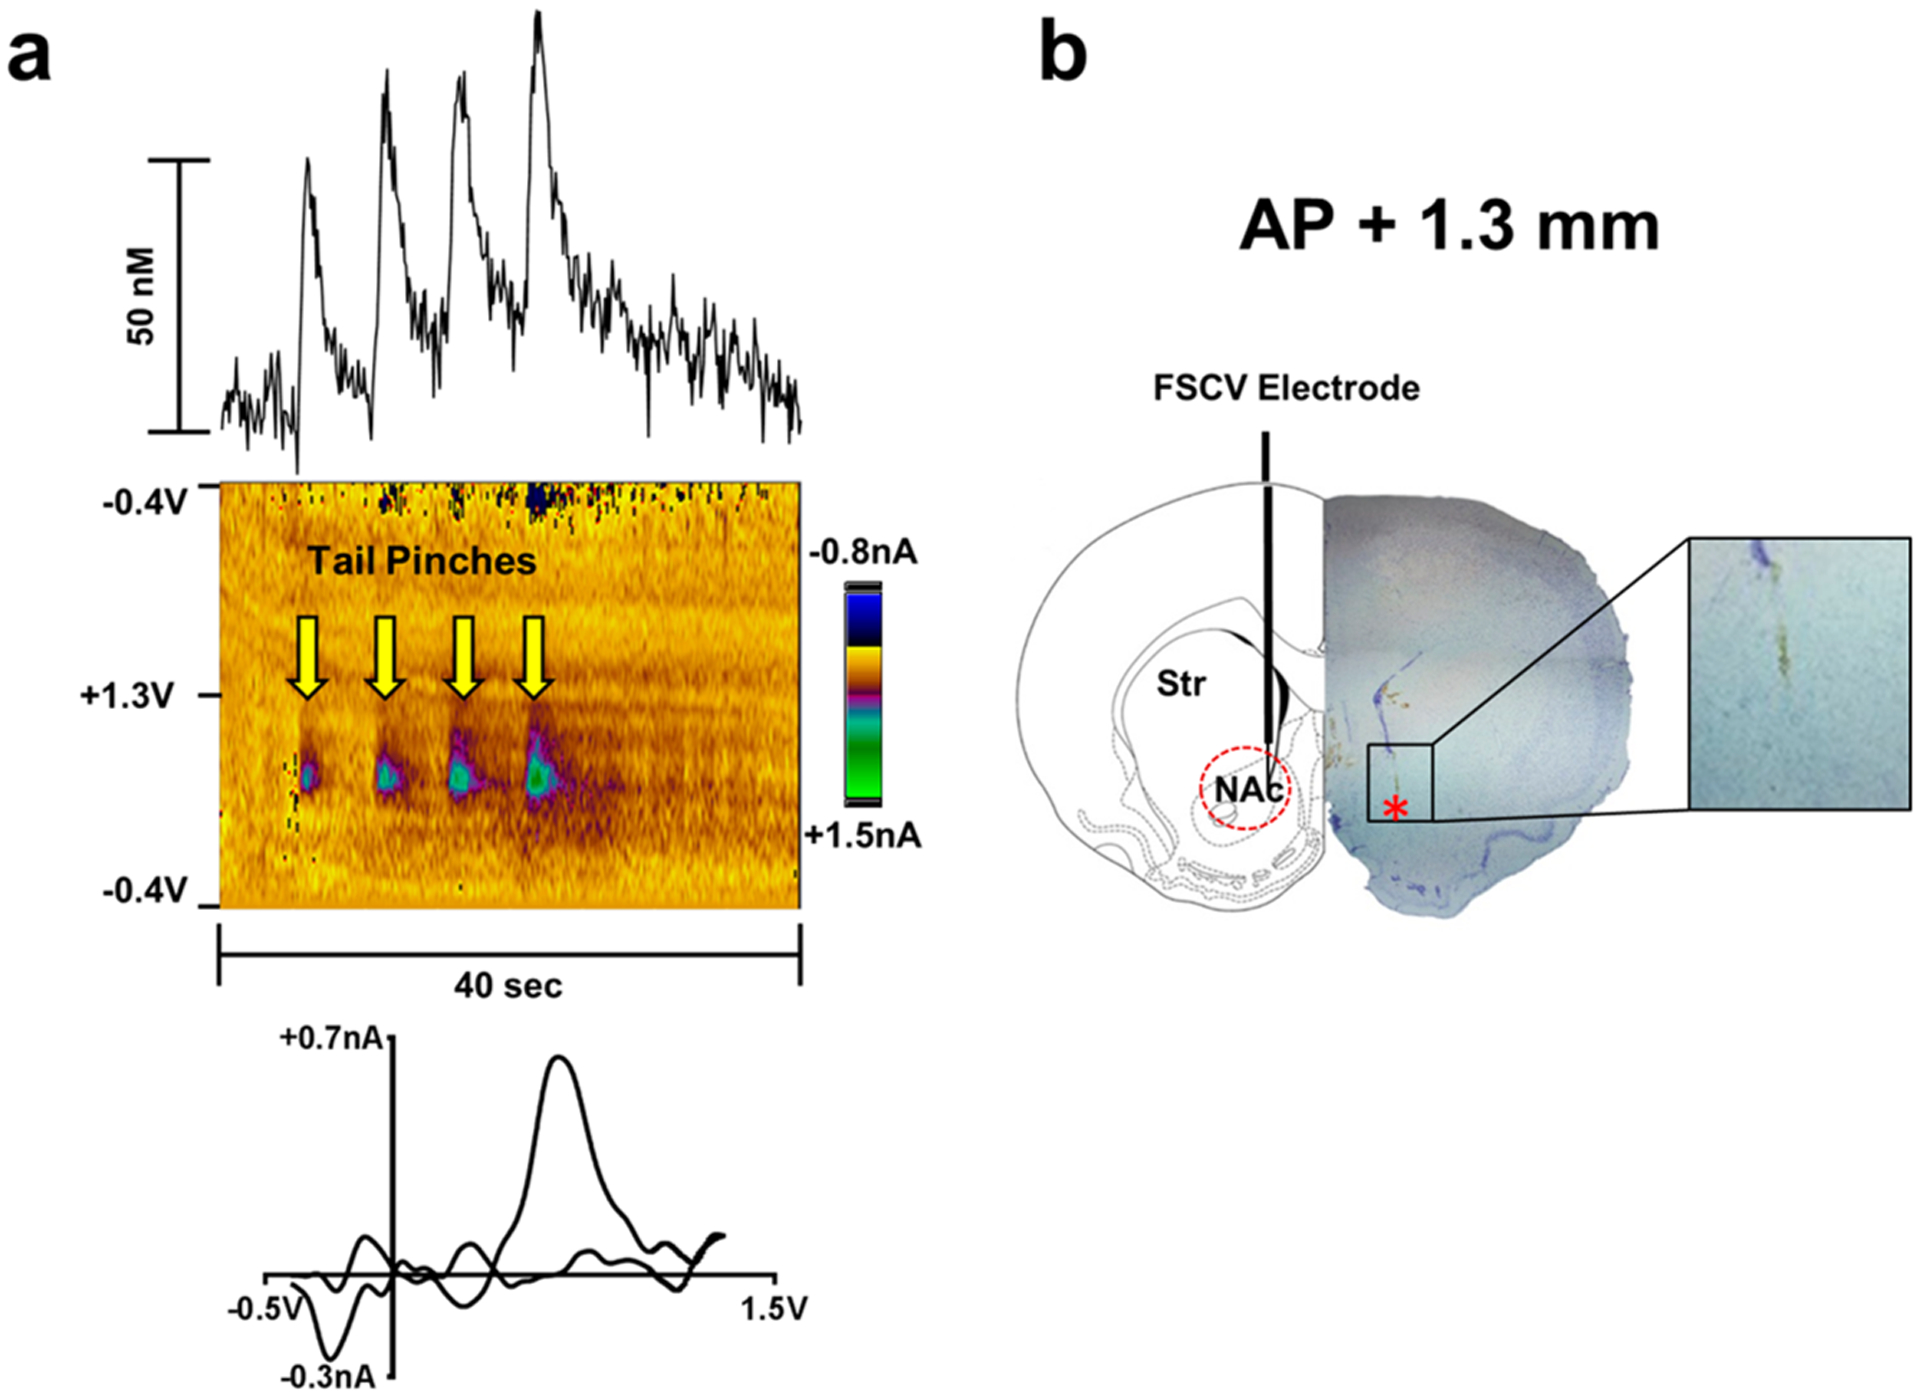
Figure 1.

(a) Changes in extracellular DA concentration measured by FSCV in rat nucleus accumbens core in response to successive tail pinches (upper panels). Color plot topographically depicts the voltammetric data, with time on the x-axis, applied scan potential on the y-axis, and background-subtracted faradaic current shown on the z-axis in pseudocolor (middle panels). Representative background-subtracted voltammogram showing characteristic oxidation and reduction peak potentials (~ +0.6 V and ~ −0.2 V, respectively) that identifies DA (lower panels). Anesthetized rats received a tail pinch every 5 s for a total of 4 pinches, while voltammetric recordings were performed over a 40 s time period. Yellow arrows indicate pinch onset. (b) Location of FSCV recordings in rat brain. On the left is a schematic drawing of a coronal slice (AP + 1.3 mm from bregma) from a rat brain atlas (Paxinos and Watson). The diagram simulates the location of the FSCV electrode that was revealed by histological analysis (right side). The dashed red circle indicates where the detecting part of electrodes was localized. On the right side is a photograph of a corresponding section where the electrode track is visible (red star indicates end of the electrode). The inset shows a magnification of the area where the detecting part of the electrode was located.
