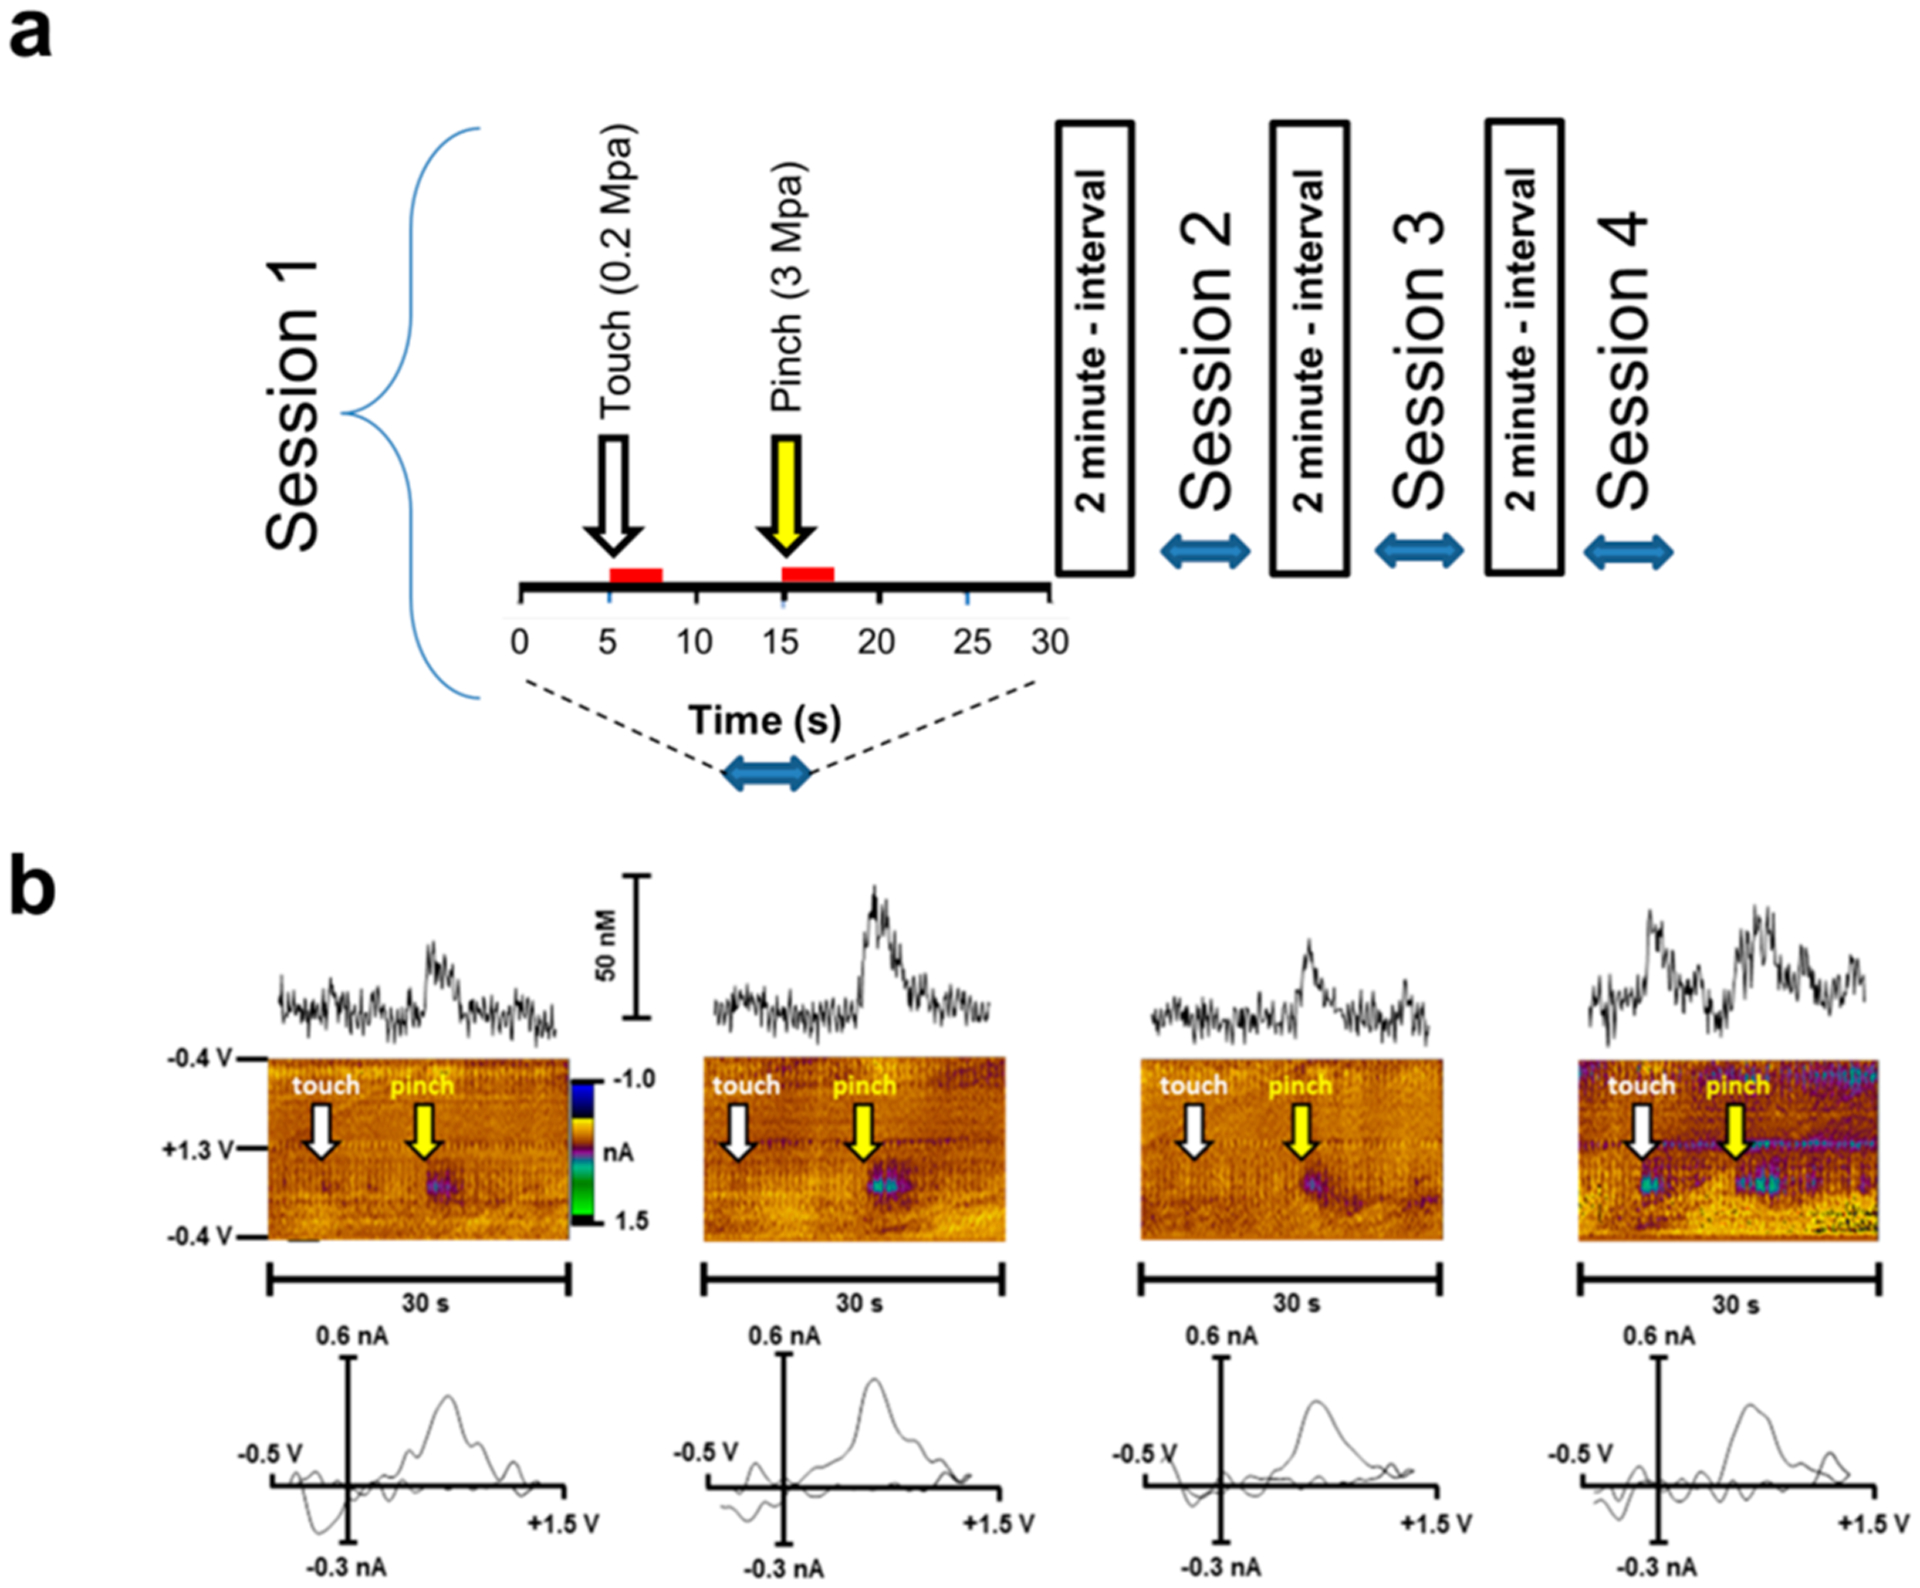
Figure 3.

(a) A schematic representation of the experiment with consecutive administration of tail pinches followed by tail touch. During a 30 s recording session, a tail touch was performed at 5 s (white arrow) for a duration of 3 s (red bar), and then a tail pinch (yellow arrow) was performed at 15 s for the same duration. The same procedure was repeated 3 more times with a 2 min interval between each. (b) Representative voltammetry data on DA measures during consecutive tail touch and pinch sessions. Changes in extracellular DA concentration versus time (upper panels) measured by FSCV in rat nucleus accumbens core of a single rat. Color plots topographically depict the voltammetric data with time on the x-axis, applied scan potential on the y-axis, and background-subtracted faradaic current shown on the z-axis in pseudocolor (middle panels). Representative background-subtracted voltammograms showing characteristic oxidation and reduction peak potentials (~ +0.6 V and ~ −0.2 V, respectively) that identify DA (lower panels).The tail pinches and touches were conducted at the same location on the tail for each trial. The tail touch elicited a similar DA response as the aversive stimulus after repeated exposure to the pinch. White arrows indicate touch onset, while yellow arrows indicate pinch onset.
