. 2019 Aug 16;9(44):25805–25816. doi: 10.1039/c9ra03644j

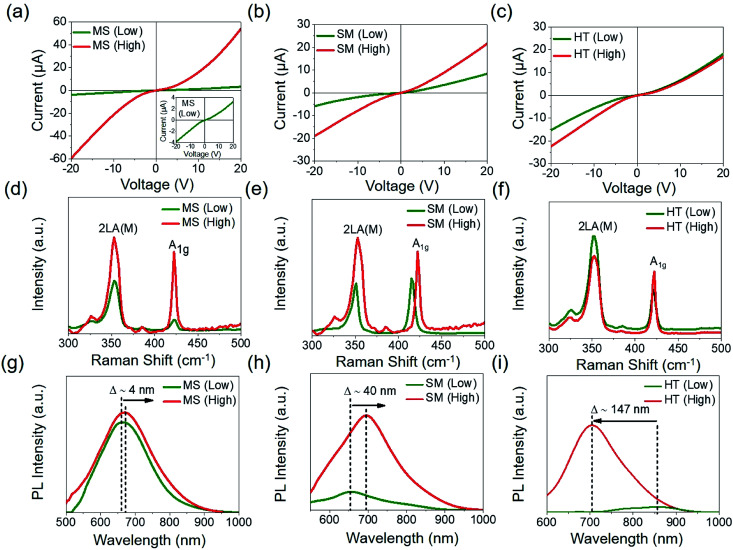
Fig. 2. IV measurements of drop-casted and annealed (a) MS (low) and MS (high) samples; inset shows the data for drop-casted and annealed MS (low) sample only on a magnified current scale. IV Characteristic for (b) SM (low) and SM (high) samples, and (c) HT (low) and HT (high) samples. Magnetic stirring showed the highest value of electrical conductivity followed by HT sonication and SM but the dispersions generated using MS were unstable. Raman spectra of drop-casted and annealed (d) MS (low) and MS (high) samples, (e) SM (low) and SM (high) samples, (f) HT (low) and HT (high) samples. Intensity ratios [I2LA(M/IA1g] of MS (low) and MS (high) sample were found to be 3.83 and 1.17, respectively, indicating the presence of few-layer WS2. Intensity ratios of SM (low) and SM (high) samples were found to be 1.16 and 0.92, respectively, again indicating the presence of few-layer WS2. Intensity ratios of HT (low) and HT (high) samples were found to be 2.11 and 1.23, respectively, again indicating the presence of few-layer WS2. The intensity ratio values are summarized in Table 1. Photoluminescence spectra of (g) MS (low) and MS (high) samples, (h) SM (low) and SM (high) samples, and (i) HT (low) and HT (high) samples. Horn-tip sonication showed the highest blue-shift in the PL peak location from low-to-high conditions, where Δ ∼ 147 nm was tabulated, while Δ for SM was ∼40 nm (red-shifted) and Δ for MS was ∼4 nm (red-shifted).

Fig. 2