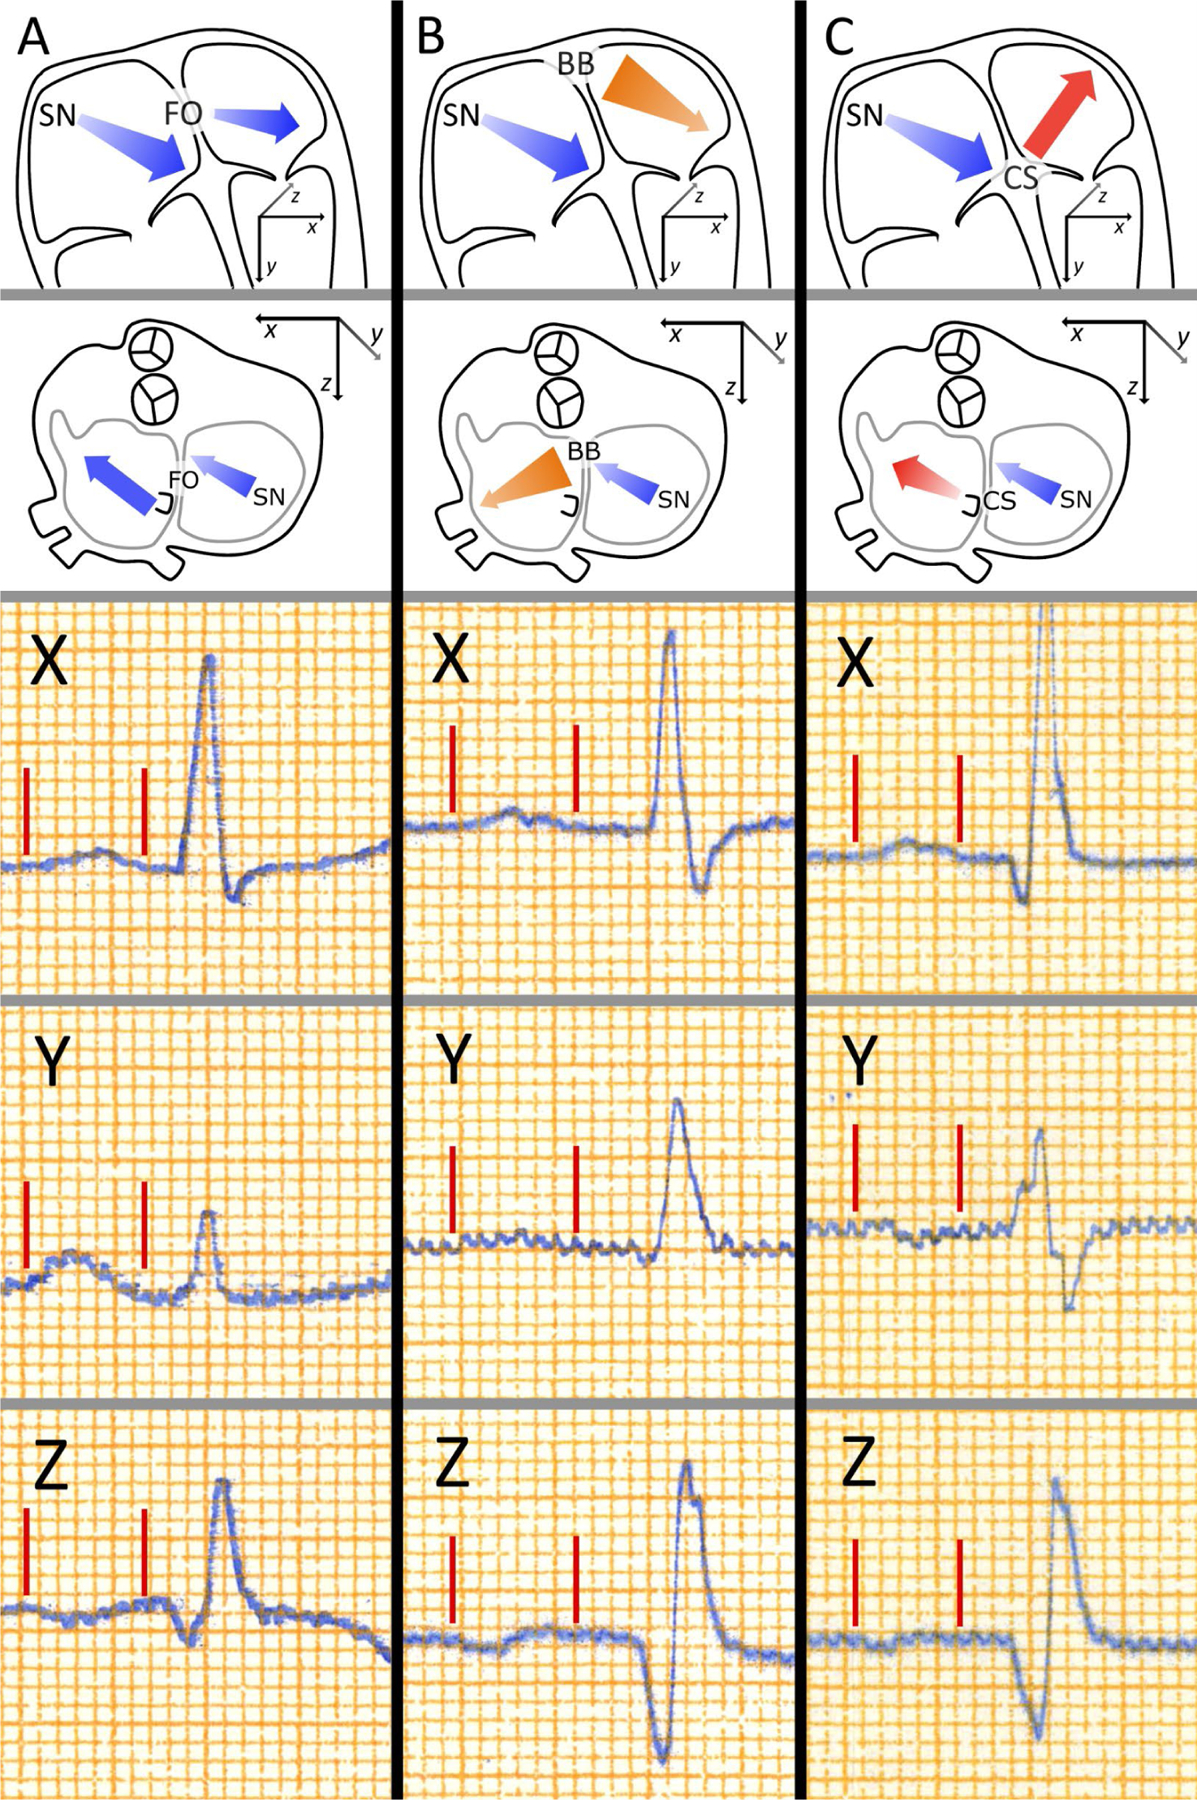
Figure 2:

Orthogonal P wave morphology. The main atrial depolarization vectors underlying the three P wave morphologies are presented in schematic illustrations of human atria in the top row (anterior view) and the second row (superior view). The three lowest rows present P waves from leads X, Y, and Z, with P wave onsets and ends marked by red lines. Atrial depolarization begins in the sinus node and the depolarization propagates anteriorly, downwards, and leftwards in the right atrium leading to a positive initial deflection in the P wave in leads X and Y, and a negative initial deflection in lead Z. Type 1 morphology (Column A) is associated with interatrial propagation of activation wavefront through posterior fibres near the fossa ovalis, leading to left atrial depolarization directed forward resulting a negative terminal portion in lead Z. Type 2 morphology (Column B) is associated with the interatrial conduction occurring exclusively through the anteriorly and superiorly located Bachmann’s bundle, which leads to inferiorly and posteriorly directed left atrial depolarization, resulting in a positive terminal portion of the P wave in lead Z. Type 3 morphology (Column C) results from left atrial breakthrough occurring near the coronary sinus, without involvement of the Bachmann’s bundle in the interatrial conduction, as in the case of advanced interatrial block, which results in the left atrial activation directed upwards leading to a negative terminal portion of the P wave in lead Y. Reprinted from reference 29.
