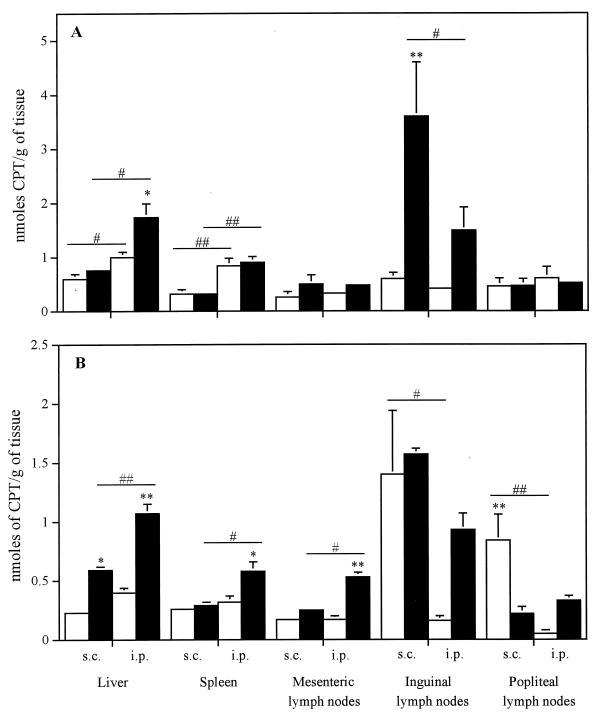
FIG. 2.
Tissue distribution of free CPT (□) and liposome-encapsulated CPT (▪) at 6 h (A) and 48 h (B) after administration of a single subcutaneous (s.c.) or intraperitoneal (i.p.) dose to uninfected BALB/c mice. Values represent the mean ± standard error of the mean for six animals per group per time point. ∗ and ∗∗, P < 0.05 and P < 0.01 compared with free CPT in the same tissue, respectively. # and ##, P < 0.05 and P < 0.01 compared with mode of administration in the same tissue, respectively.

