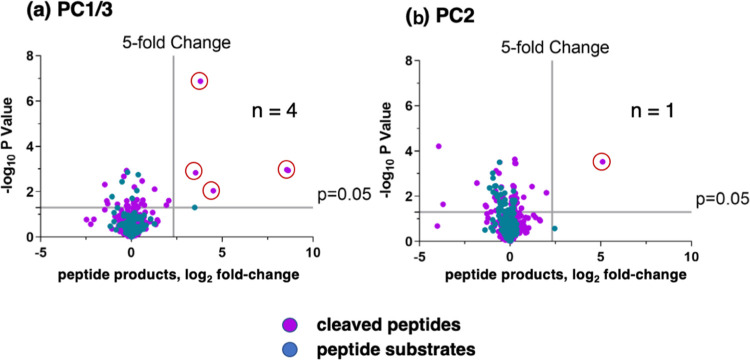
Figure 4.
PC1/3 and PC2 cleavage profiling analyzed by MSP-MS. Volcano plots of PC1/3 (panel a) and PC2 (panel b) peptide cleavages from MSP-MS data show the log2 ratios of relative quantities of peptide products generated by PC1/3 and PC2 (60 min incubation at pH 5.5) compared to no enzyme activity controls, illustrated by −log10p values. Peptide products generated with at least a 5-fold change above controls and with p < 0.05 were analyzed for the frequencies of amino acid residues at the P4–P4′ positions of the P1–↓P1′ cleavage site.

