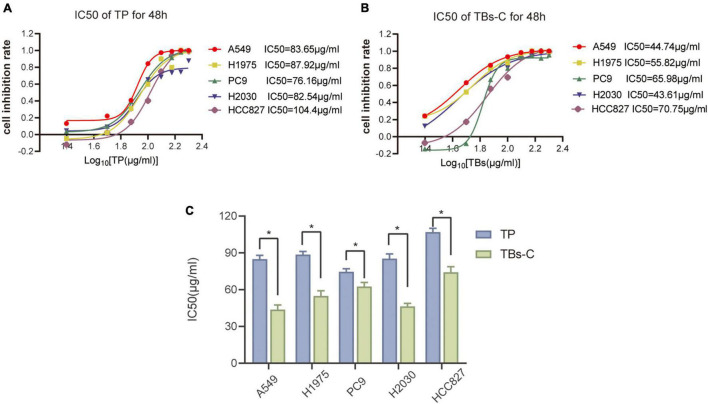
FIGURE 1.
Comparison of the anti-tumor effects of TBs-C and TP on NSCLC cells. (A,B) The experimental cells were treated with different concentrations (0, 25, 50, 75, 100, 125, 150, 175, and 200 μg/mL) of TBs-C and TP for 48 h, and the cell viability was determined by the CCK-8 assay, with the calculation of the IC50 values. (C) The comparison of the IC50 values between TP and TBs-C in different NSCLC cell lines are presented, *p < 0.05.

