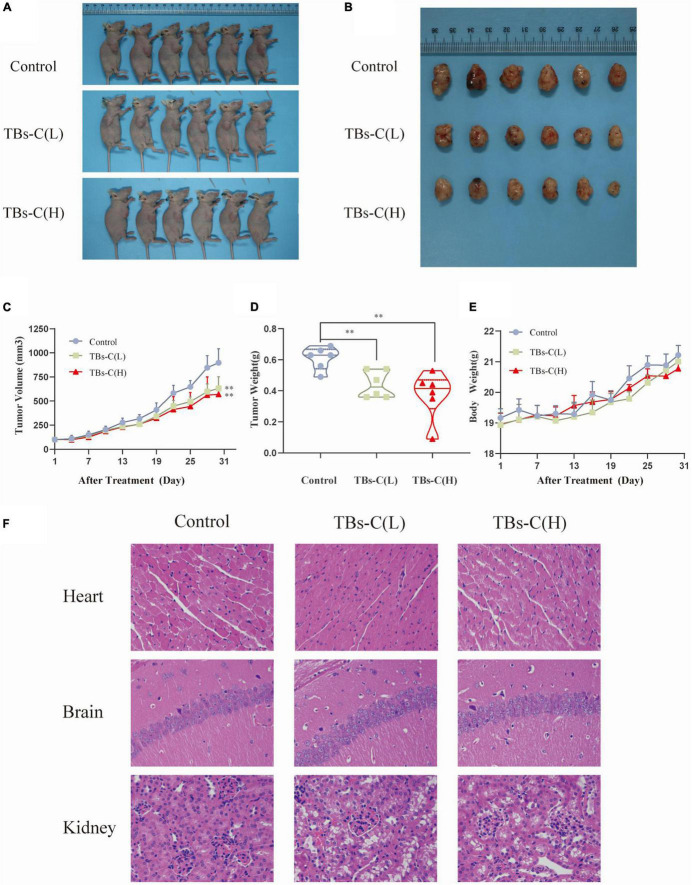
FIGURE 8.
TBs-C inhibits the growth of A549 xenograft tumors in vivo. (A) Tumorigenesis of A549 cells of the 3 study groups on day 28. (B) Representative size of the 3 groups of tumors. (C) Tumor volumes (measured every 3 days). (D) Tumor weight in the control group, low-dose group, and high-dose group. (E) The weight of nude mice was recorded every 3 days. (F) H&E stained the heart, brain, and kidney of mice from each group. TBs-C (L), TBs-C low-dose group, TBs-C (H), TBs-C high-dose group, *p < 0.05, **p < 0.01.

