
Fig. 1.
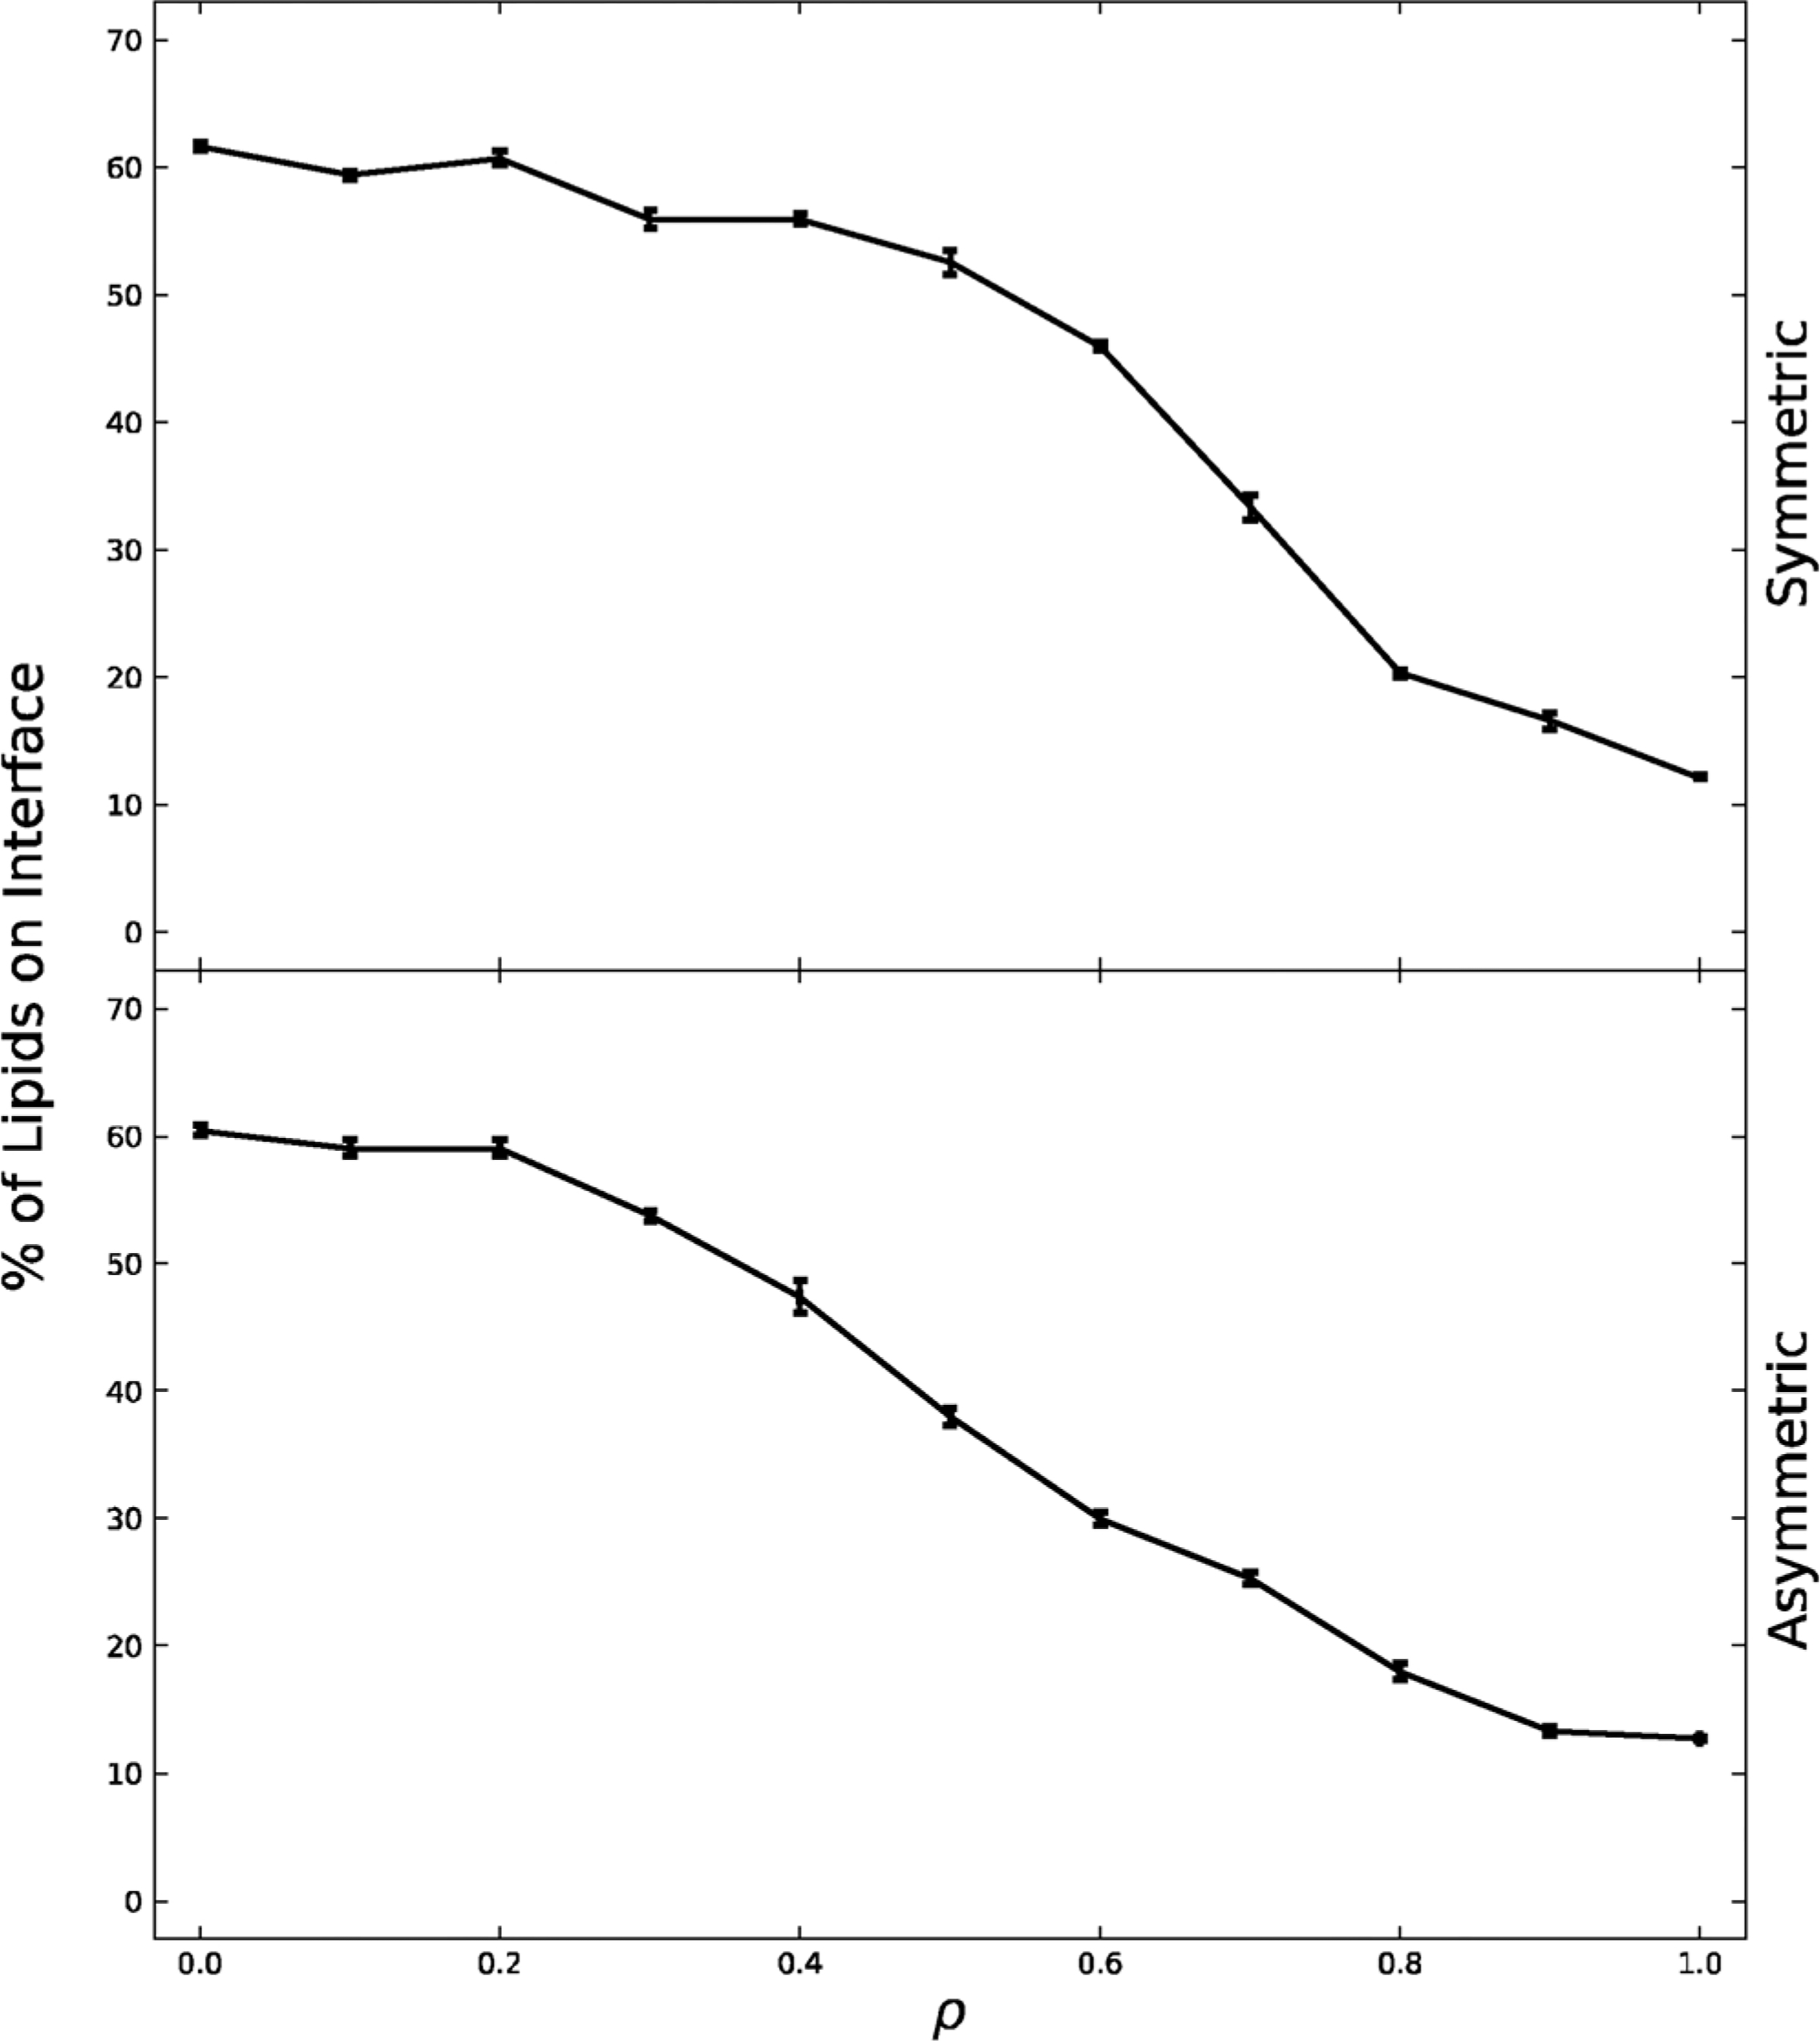
Percentage of lipids on the interface graphed for the exoplasmic symmetric and asymmetric leaflets across the ρ trajectory. Percentage of lipids on the interface decreases as ρ increases, indicating a transition from nanodomains to macrodomains. The symmetric system decreases more sharply at ρ ≈ 0.7, leading ρ ≈ .7 to be characterized as the critical ρ value (ρ*). The asymmetric system goes through no such steep transition. Standard error is shown.