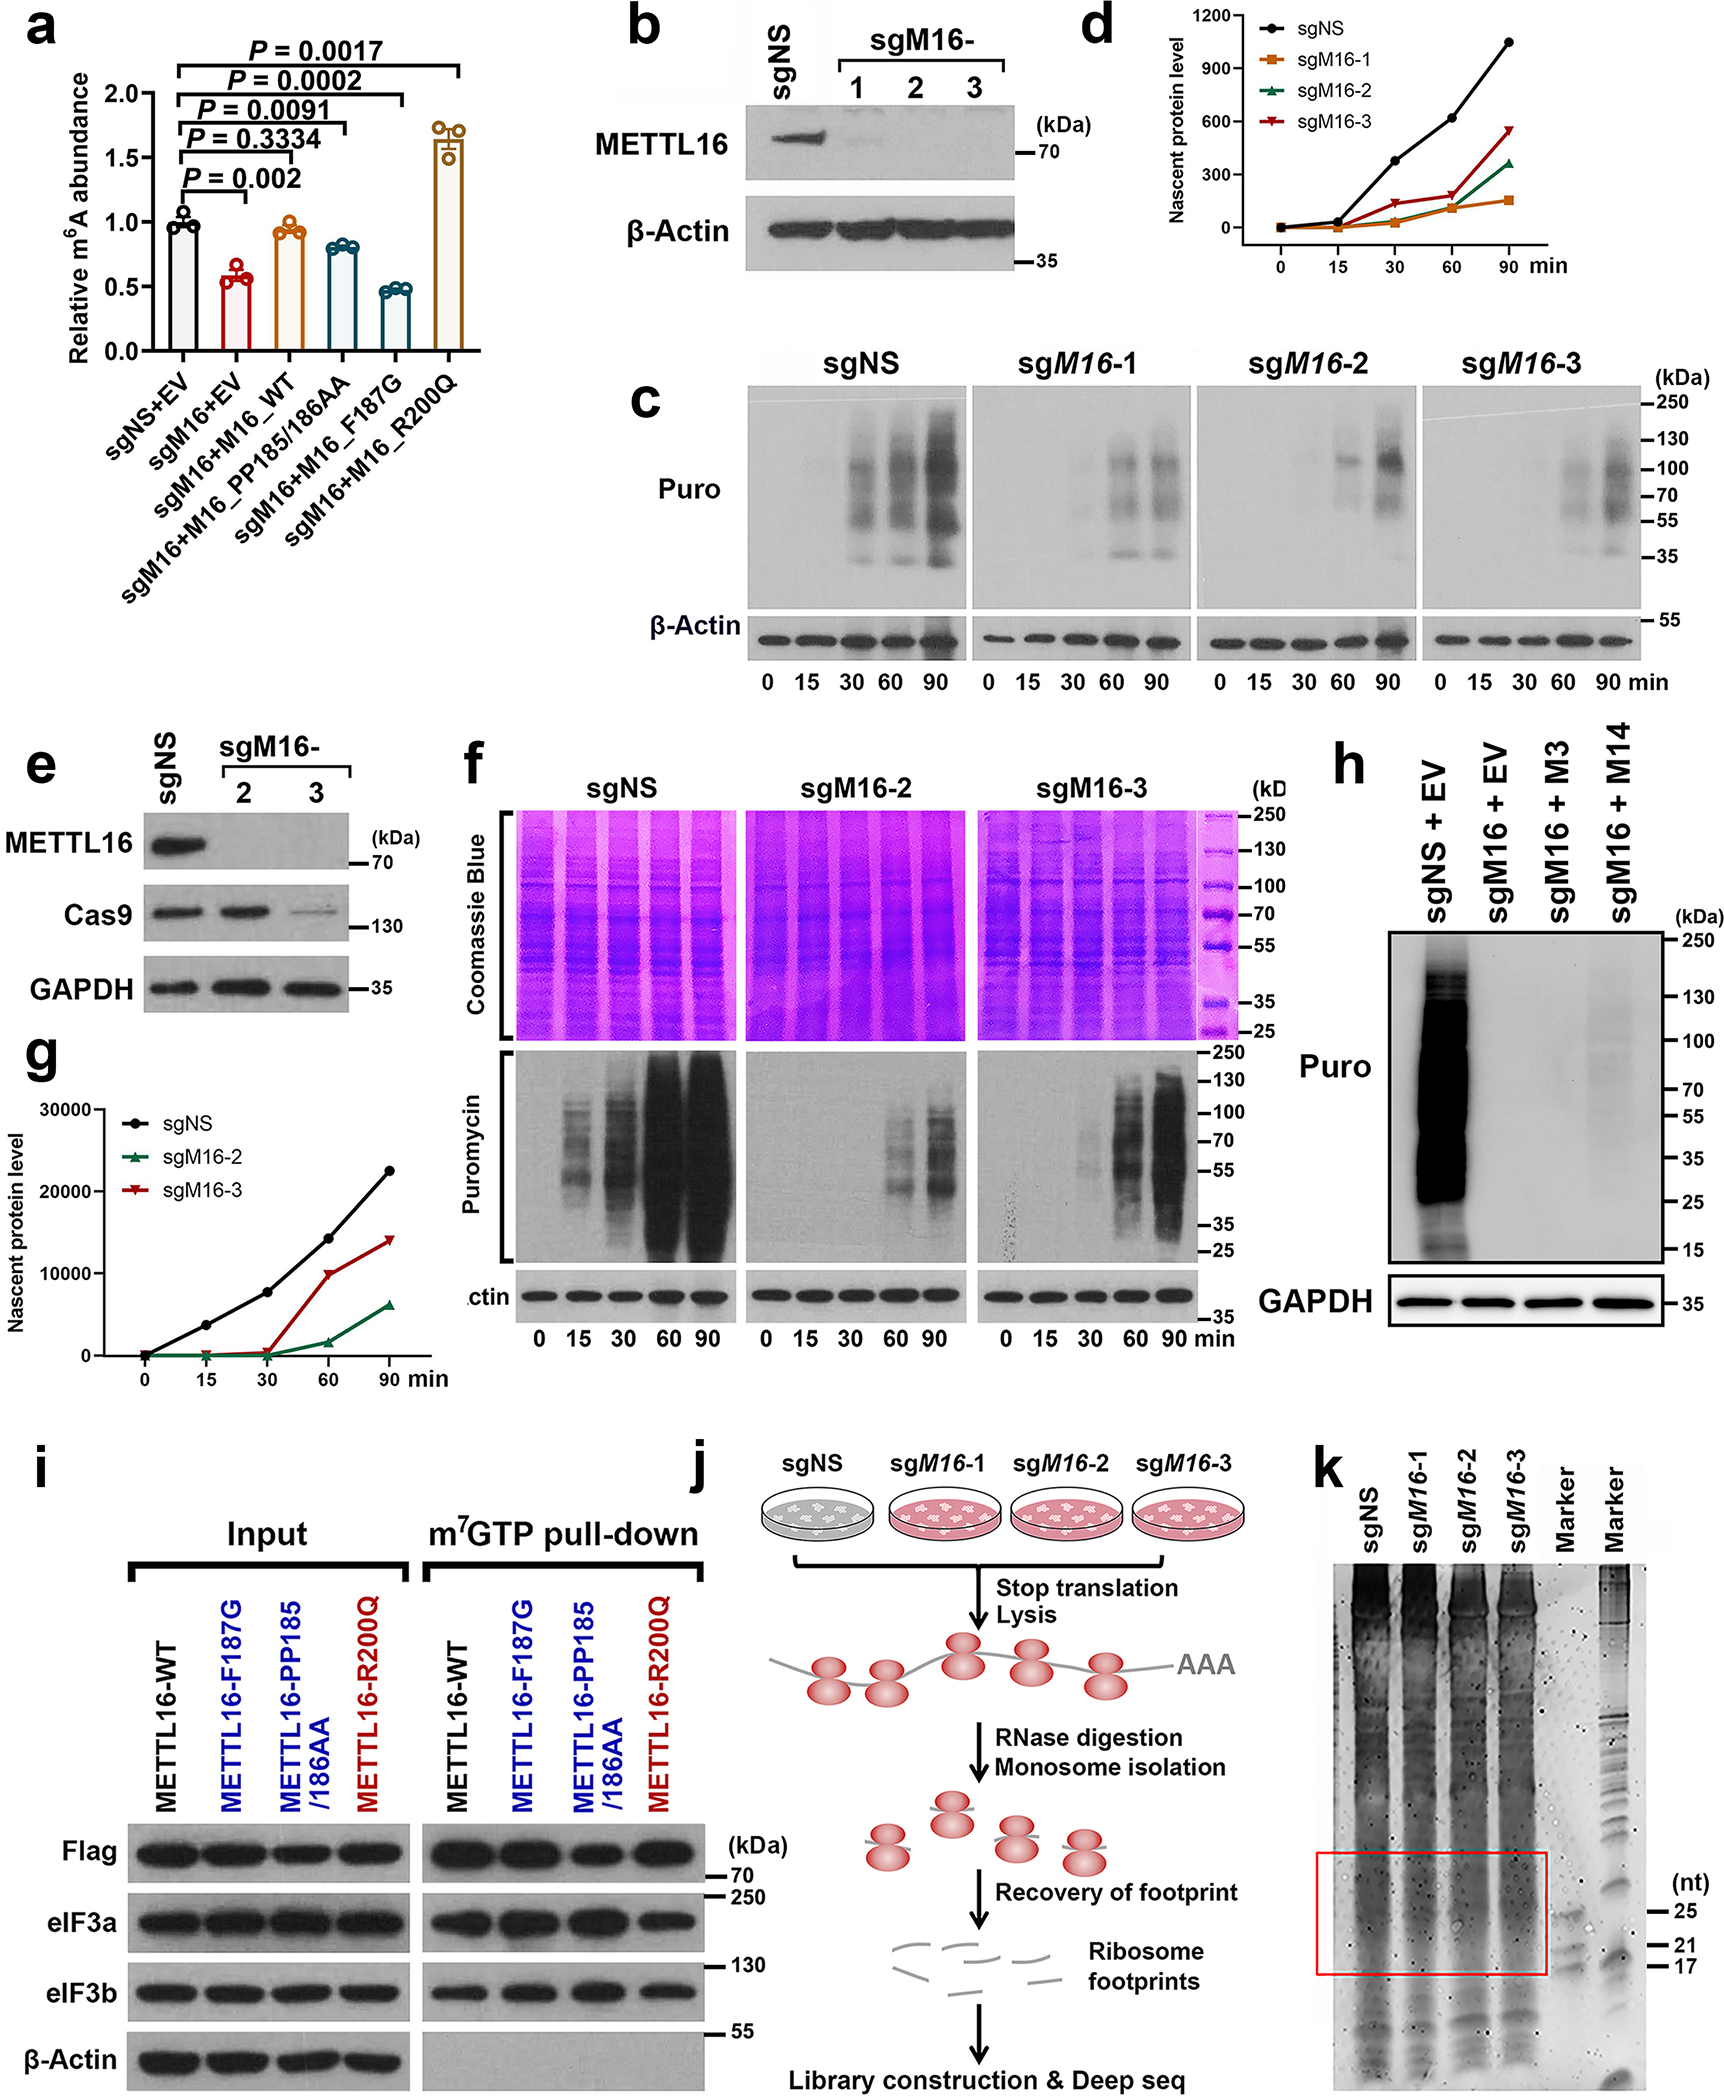
Extended Data Fig. 4. METTL16 enhances translation efficiency.

a, Relative m6A level changes in U6 snRNA in METTL16 KO (sgMETTL16-2) HEK293T cells upon ectopic expression of METTL16 WT and mutants (F187G, PP185/186AA, and R200Q) as determined by gene-specific m6A qPCR. Data are mean ± s.e.m. (n = 3 independent experiment). Statistics: unpaired, two-sided t-test. b, Western blotting confirming the KO efficacy of the sgRNAs against METTL16 in HEK293T cells. Images are representative of three biologically independent experiments with similar results. c, d, Representative WB images of SUnSET assays (c) and the quantitative SUnSET data (d) showing the effects of METTL16 KO on translation efficiency (based on the levels of nascent protein levels at given time periods) in HEK293T cells. β-Actin was used as loading controls. To make the data comparable, all the conditions for each sample are the same, including the total amount of loaded protein, concentration of antibodies, the time to run SDS-gel, transfer membrane, and develop signals. Representative images from three independent experiments with similar results were displayed. e, Western blotting showing the efficiency of METTL16 KO in K562 cells. f, g, Representative WB images of SUnSET assays (f) and the quantitative SUnSET data (g) showing the translation efficiency in K562 cells upon METTL16 deletion. Both Coomassie blue staining and β-Actin were used as loading controls. h, Effects of METTL3 and METTL14 overexpression on translation efficiency in HEK293T cells with endogenous METTL16 KO (sgMETTL16-2). All the cells were pulsed with puromycin for 60 minutes. Images are representative of three biologically independent experiments with similar results. i, Western blotting of the m7G pulldown assays to determine the potential binding of METTL16 WT and mutants in the 5’ cap region. Representative images from two independent m7G pulldown assays with similar results were presented. j, Experimental workflow of ribosome profiling with HEK293T cells upon METTL16 KO. k, The image of RNA gel with the ribosome footprint samples. The footprints within 17–34 nt were recovered for library construction and deep sequencing.
