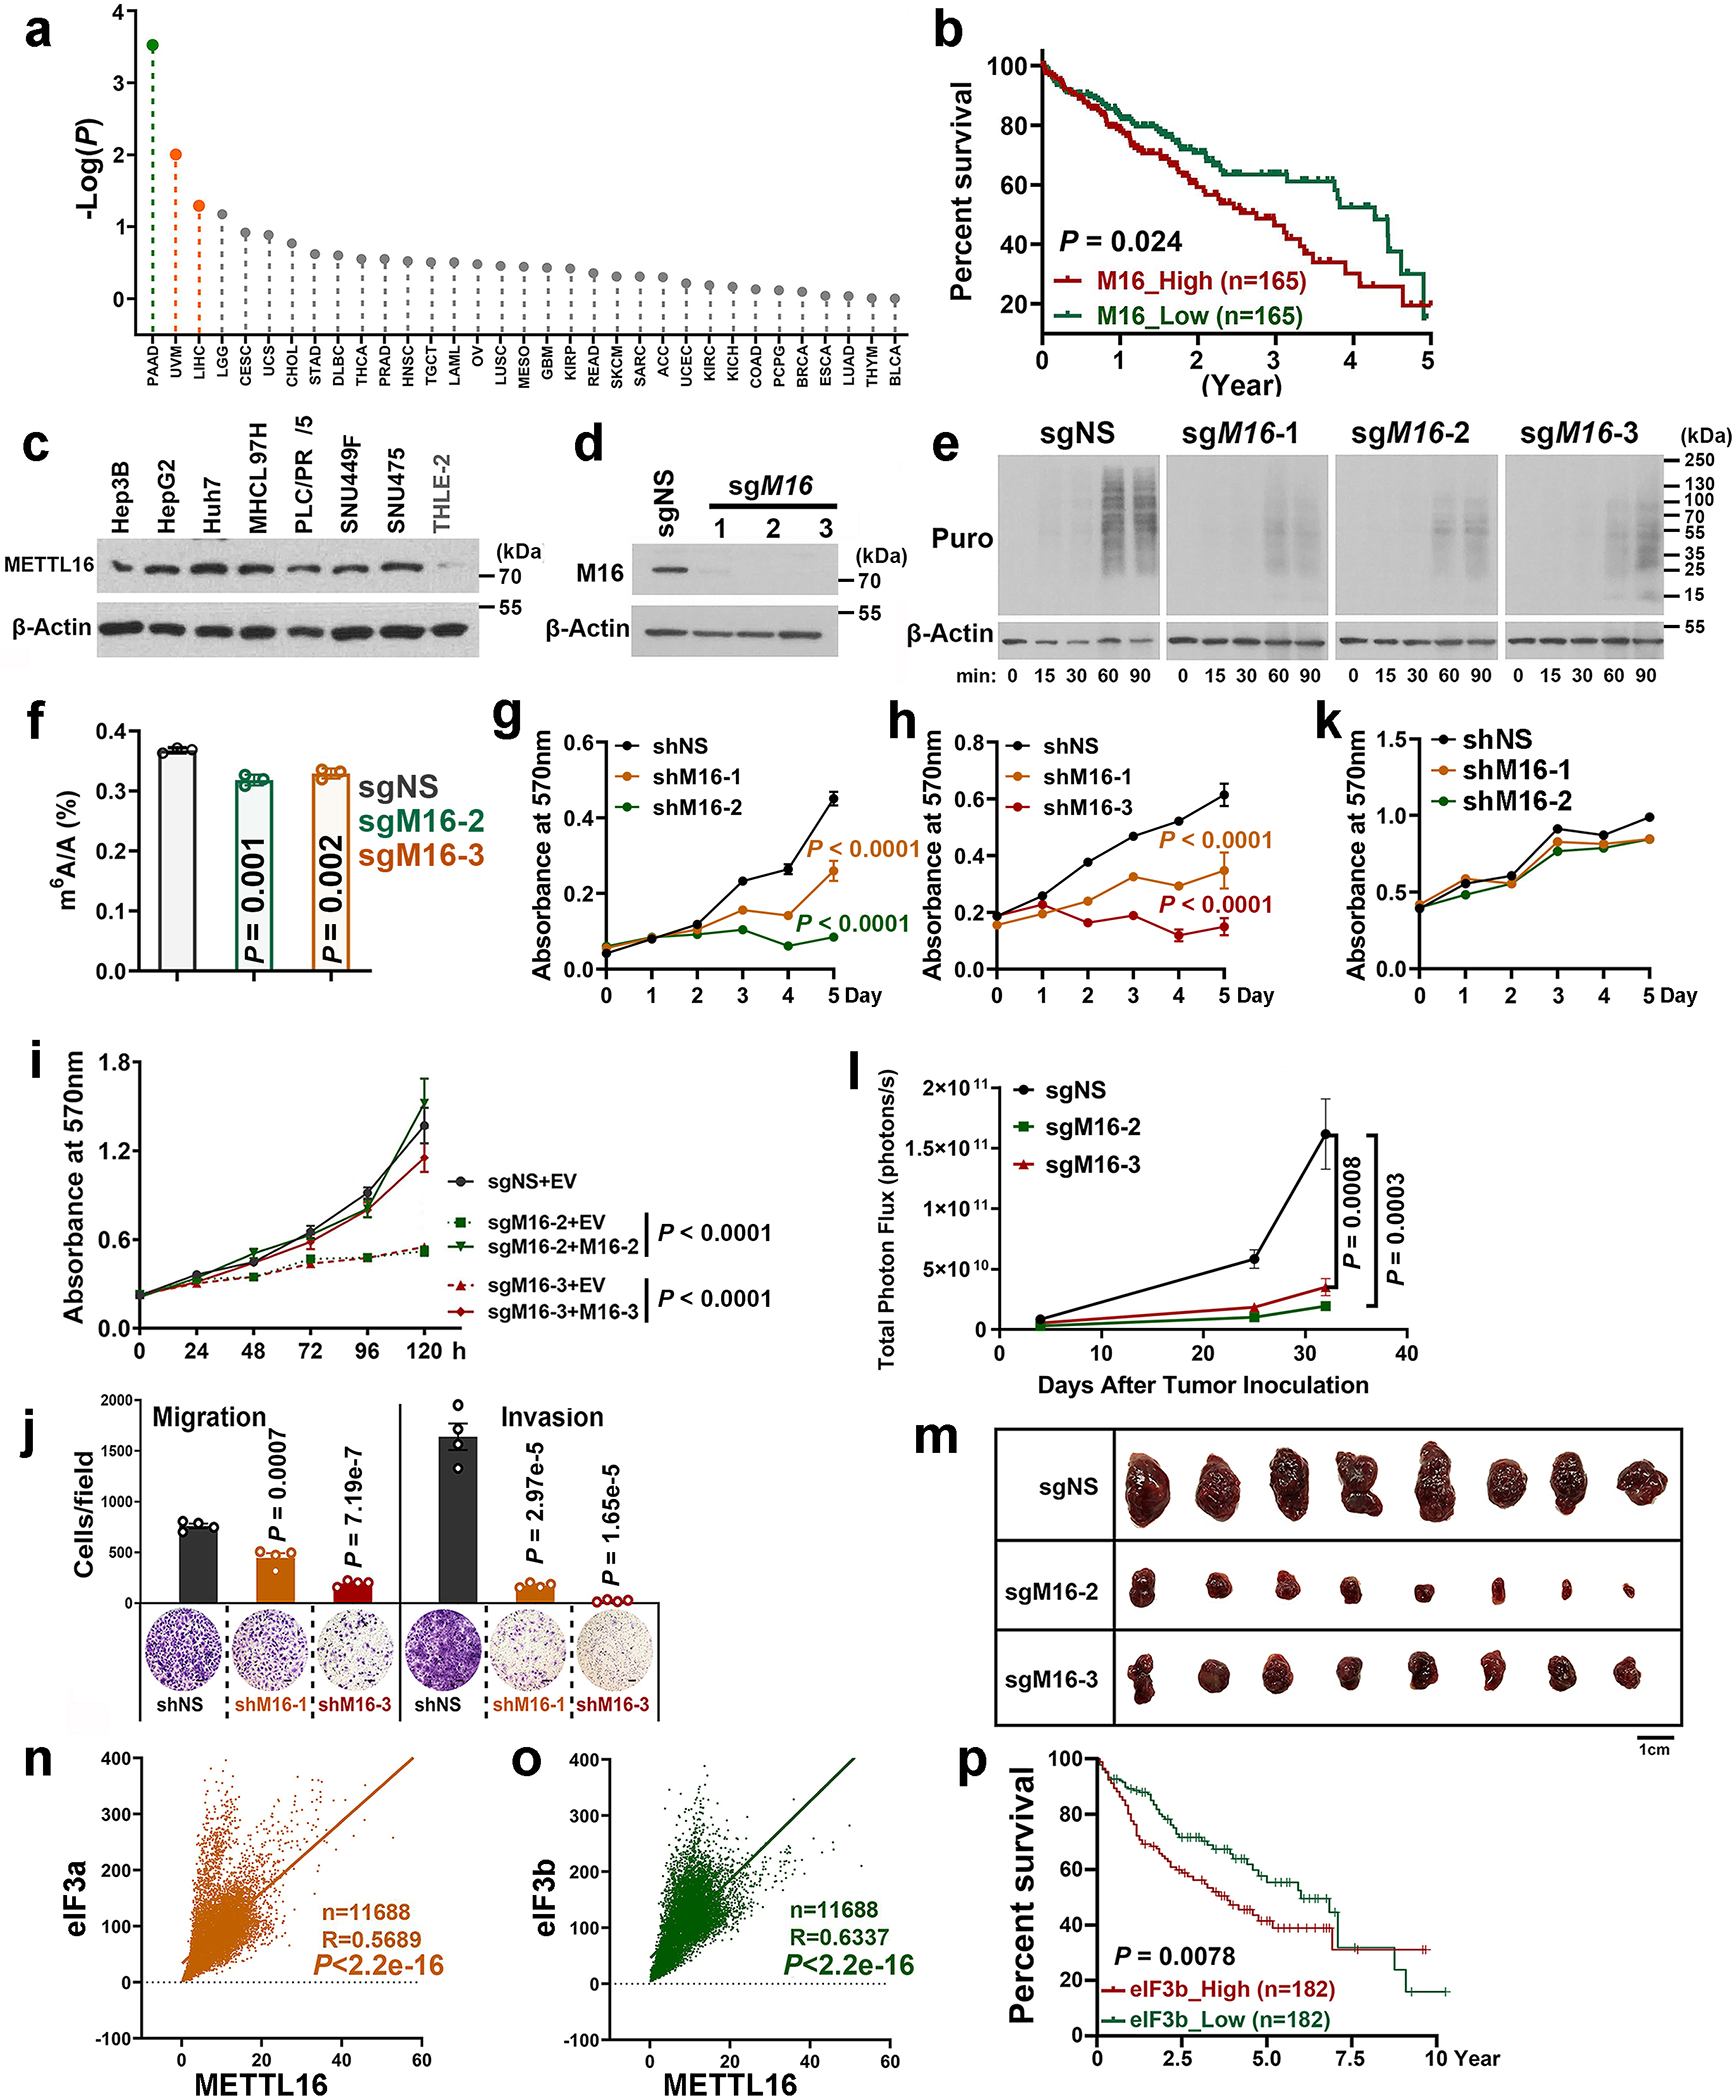
Extended Data Fig. 8. The tumor-promoting role of METTL16 in hepatocellular carcinoma (HCC) and its positive correlations with eIF3a/b in expression.

a, The prognostic impacts of METTL16 expression levels in the TCGA cancer patient datasets, which were downloaded from GEPIA2 (http://gepia2.cancer-pku.cn/#index). In each cancer type, the overall survivals between patients with high METTL16 expression levels (the top 50%) and those with low levels (the low 50%) were compared and the P value was calculated by the log-rank test, and then the -Log(P) value was presented. In PAAD (Pancreatic adenocarcinoma), high expression of METTL16 significantly (P < 0.05) correlates with better survival; while in UVM (Uveal melanoma) and LIHC (Liver hepatocellular carcinoma), high expression of METTL16 significantly (P < 0.05) correlates with poorer survival. METTL16 expression levels are not significantly associated with prognosis in other cancer types. b, Overall survival analysis of METTL16 in HCC from the TCGA dataset. The P value is determined by logrank test. c, Expression of METTL16 in liver cancer cell lines (Hep3B, HepG2, Huh7, MHCC97H, PLC/PRF/5, SUN449, and SUN475) and healthy liver cell line (THLE-2). Representative images from two independent replicates with similar results were presented. d, Validation of METTL16 KO efficiency via Western blotting in HepG2 Cas9 single clone. e, The Western blotting images of SUnSET assays showing the effects of METTL16 KO on translation efficiency in HepG2 liver cancer cells. To make the data comparable, all the conditions for each sample are the same, including the total amount of loaded protein, concentration of antibodies, the time to run SDS-gel, transfer membrane, and develop signals. f, Determination of m6A levels in mRNAs of HepG2 cells with or without METTL16 KO via QQQ-MS. Data are mean ± s.d. Data shown represent 3 independent experiments. Statistics: unpaired, two-sided t-test. g, h, Effects of METTL16 KD on cell growth in SNU449 (g) and SNU475 (h) HCC cells. Data are plotted as mean ± s.d. (n=3 independent experiments). Statistics: two-way ANOVA. i, Effects of METTL16 expression changes on the growth of HepG2 cells. METTL16 KO (sgM16–2 + EV; sgM16–3 + EV) drastically suppressed cell proliferation as determined by MTT assays; restored expression of METTL16 (sgM16–2 + M16–2; sgM16–3 + M16–3) could rescue/reverse the inhibitory effect of METTL16 KO. Here, M16–2 and M16–3 represent the synonymous mutations of METTL16 ORF that can’t be targeted by sgM16-2 and sgM16-3, respectively. Data are plotted as mean ± s.d. n = 4 (sgM16–2 + M16–2, 120 h; and sgM16–3 + M16–3, 120h); n =5 (sgM16–3 + M16–3, 72h); n = 6 (all other groups) independent experiments. Statistics: two-way ANOVA. j, Effects of METTL16 KD on the migration and invasion of SUN475 liver cancer cells. Data are mean ± s.d. (n=3 independent experiments). Statistics: unpaired two-sided t-test. k, The effects of METTL16 KD on cell proliferation in THLE-2 cells (a primary human normal liver cell line). Data are plotted as mean ± s.e.m. (n=3 independent experiments). l, Total photon flux of the mice xenografted with HepG2 cells with or without METTL16 KO. Data are plotted as mean ± s.e.m. (n=8 independent mice). Statistics: two-way ANOVA. m, Tumor images at the endpoint of the xenograft models implanted with HepG2 liver cancer cells with or without METTL16 KO. n, o, The correlation between METTL16 and eIF3a (n), or eIF3b (o) in expression as detected by Pearson’s correlation analysis. All the raw data were downloaded from GTEx (Genotype-Tissue Expression, https://www.gtexportal.org/home/). The number of samples, R value, and P value were displayed. Statistics: Pearson correlation. p, Overall survival analysis of eIF3b in HCC from the TCGA dataset. The P value is determined by logrank test.
