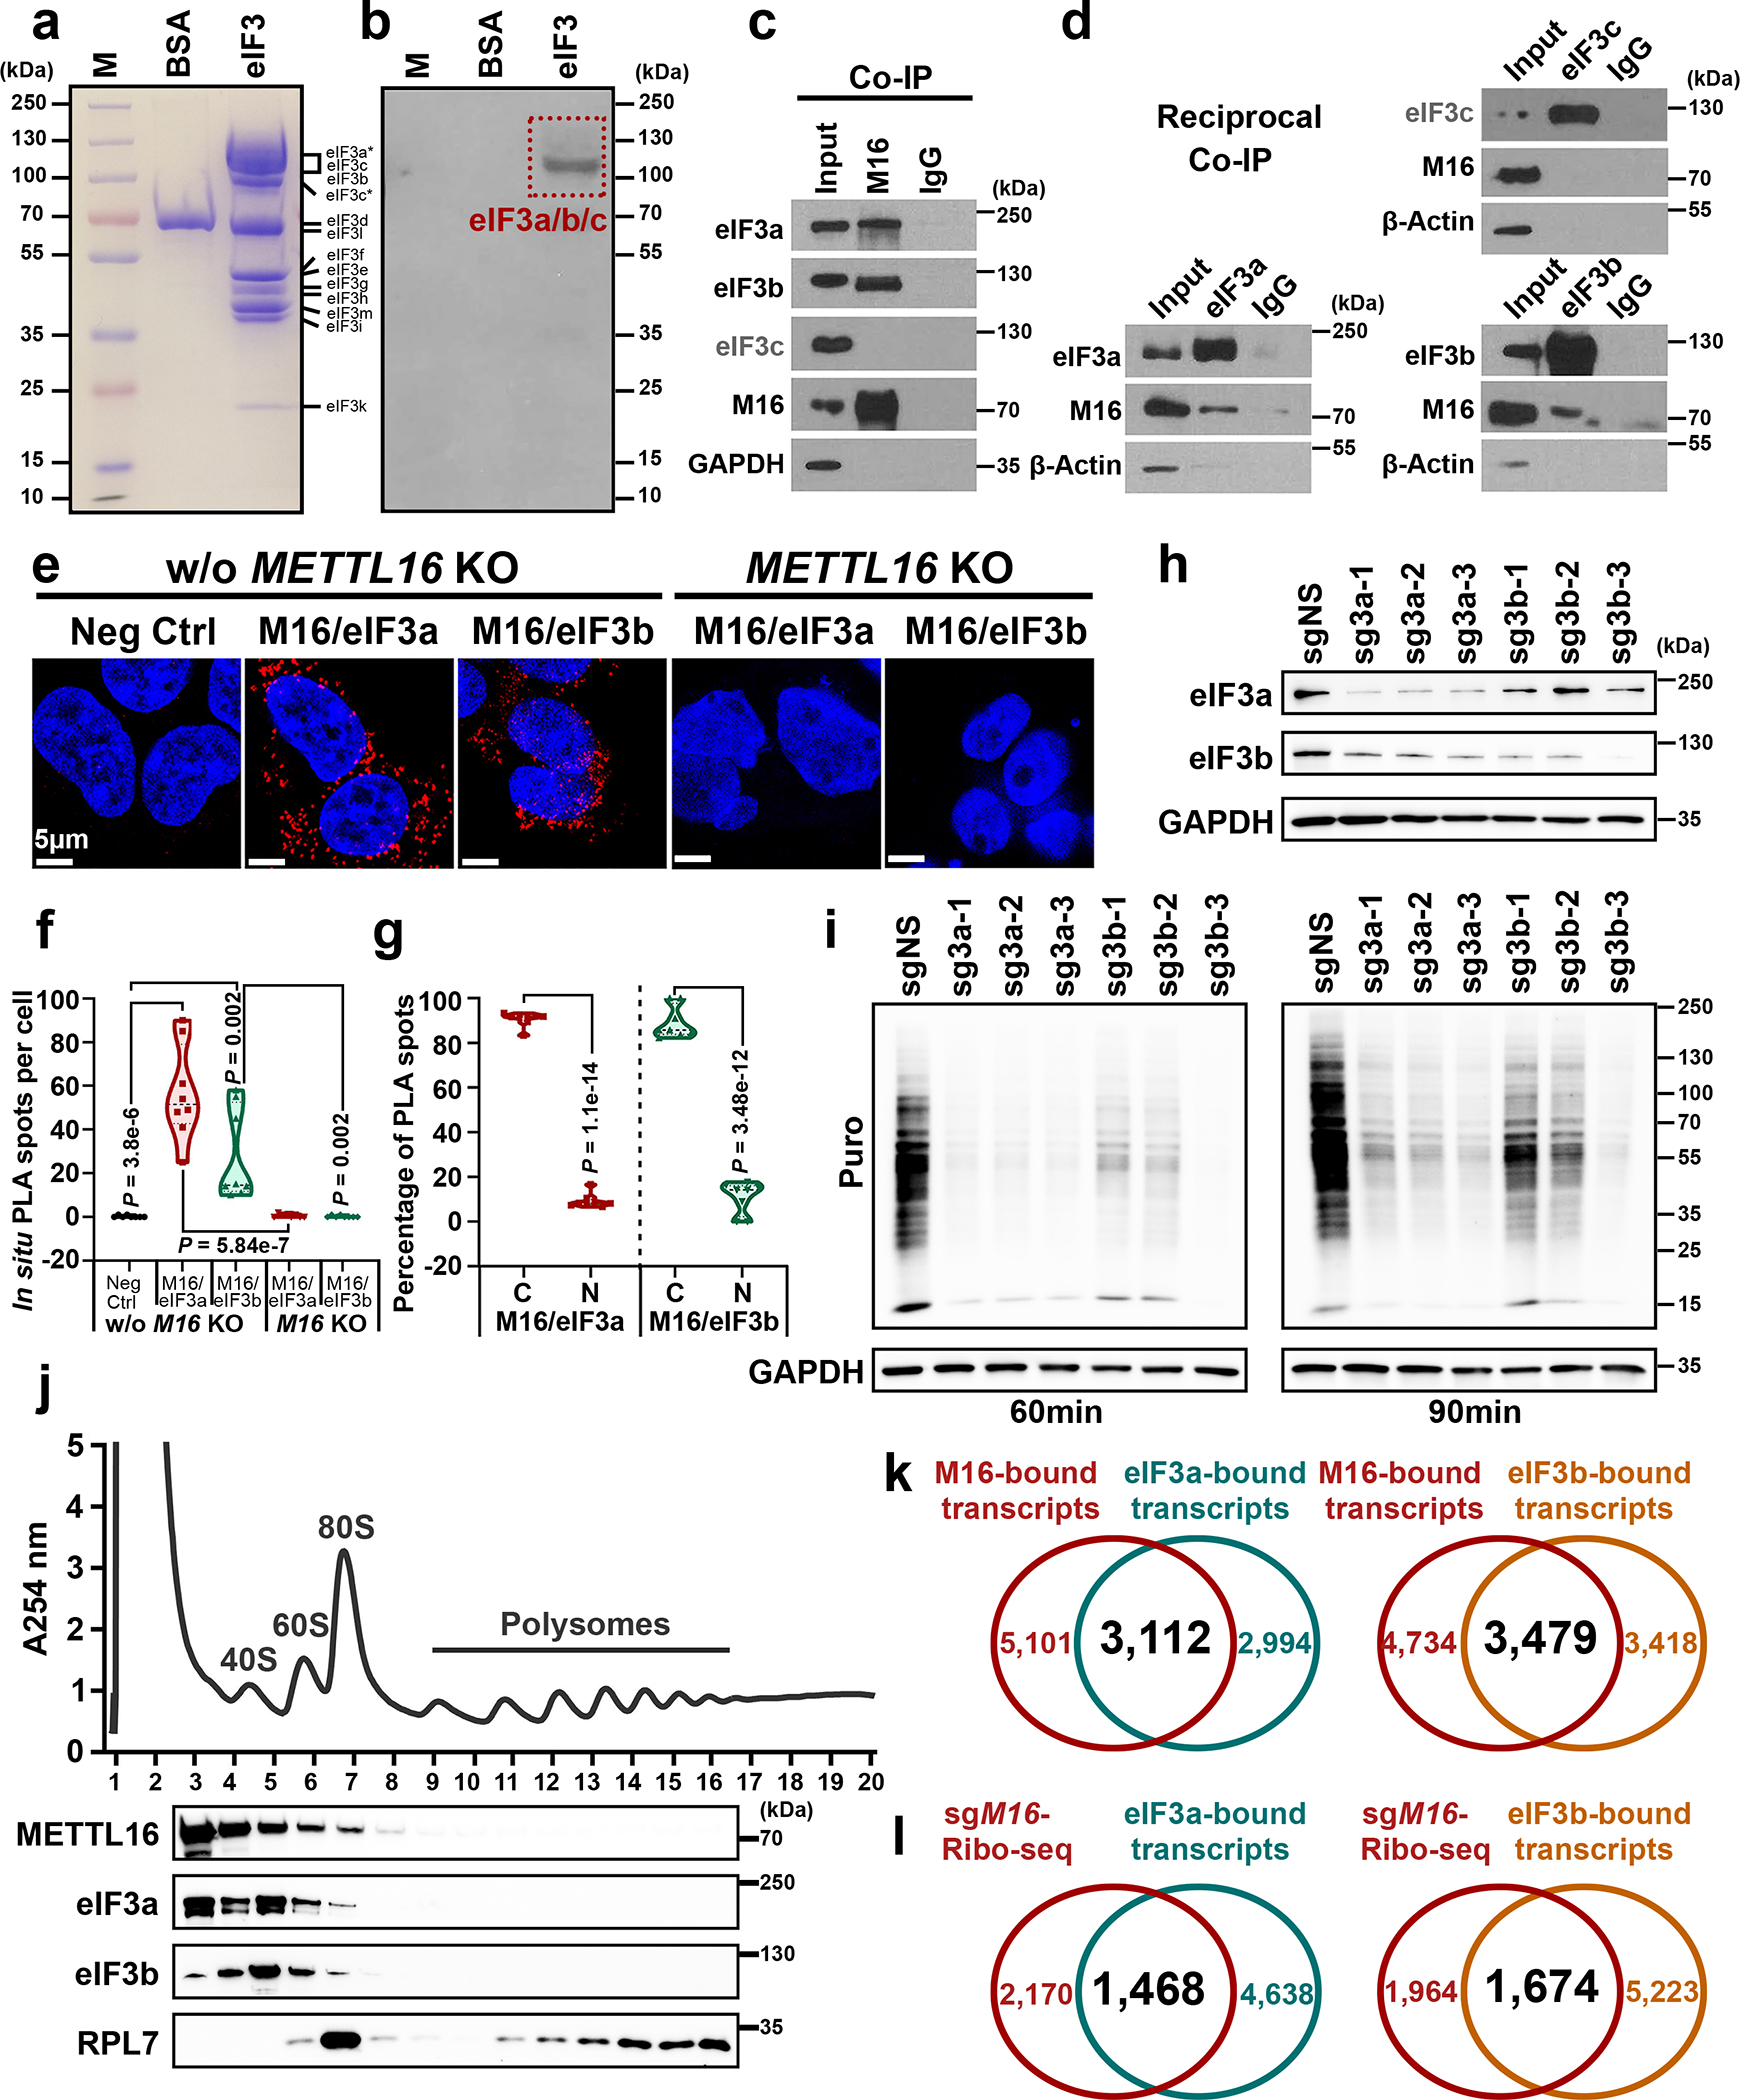
Fig. 3. METTL16 facilitates translation initiation via direct interaction with eIF3a and eIF3b.

a, Coomassie brilliant blue staining of protein markers, BSA (negative control), and eIF3 family members. b, Far-Western blotting for the direct interaction between METTL16 and eIF3 family members. Images in a and b are representative of three biologically independent experiments with consistent results. c, Co-IP of METTL16 with endogenous eIF3a, eIF3b, and eIF3c. d, Reciprocal Co-IP of endogenous eIF3a, eIF3b, and eIF3c with METTL16. Data shown represent 2 independent experiments. e, In situ detection of METTL16-eIF3a and METTL16-eIF3b interaction via proximity ligation assays (PLA) in HEK293T cells with or without METTL16 KO. f, Quantification of in situ PLA puncta from the five groups. Statistics: unpaired, two-tailed t-test. n = 8 independent experiments. g, The distribution of in situ PLA spots from METTL16-eIF3a and METTL16-eIF3b in cytoplasm (C) and nuclear (N) of HEK293T cells without METTL16 KO. Statistics: unpaired, two-tailed t-test. n = 8 independent experiments. h, The KO efficiency of eIF3a and eIF3b in HEK293T cells. i, Representative Western blotting images of SUnSET assays to quantify the amount of nascent peptides in HEK293T cells with eIF3a and eIF3b KO. Data shown represent 3 independent experiments. j, Polysome profiles of HEK293T cells as determined by sucrose density gradient ultracentrifugation. The localization of eIF3a, eIF3b, METTL16, and RPL7 proteins were validated by Western blotting. Data shown represent 3 independent experiments. k, Venn diagram showing the overlap between METTL16-bound transcripts and eIF3a-bound transcripts (left), or between METTL16-bound transcripts and eIF3b-bound transcripts (right). Both the eIF3a- and eIF3b-bound transcripts were downloaded from the POSTAR3 (http://postar.ncrnalab.org/). l, Venn diagram showing the overlap between the transcripts with decreased translation efficiency in METTL16 KO cells and the transcripts directly bound by eIF3a (left) or eIF3b (right).
