Figure 2.
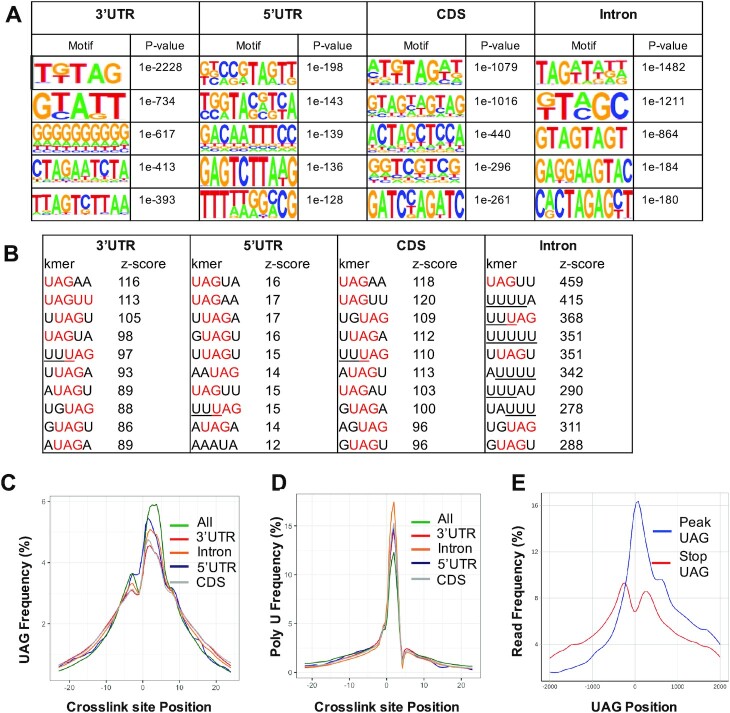
Sequence motifs in FLAG-MSI2 iCLIP datasets. (A) Motifs identified in regions −20 to +20 from high-confidence iCLIP cross-link sites (FDR < 0.05) by the HOMER algorithm. Top 5 motifs along with the corresponding P-values are shown for each of the transcript regions (5′UTR, CDS, 3′UTR and introns). (B) Ten most frequent 5-mers identified in a window of −20 to +20 nucleotides with respect to cross-link sites for each of the transcript regions (5′UTR, CDS, 3′UTR and introns). UAG motifs within these 5-mers are denoted in red and poly-U stretches (>3) are underlined. (C) Distribution of ‘UAG’ motifs upstream and downstream (−25 to +25 nucleotides) of the cross-link sites. Frequency distribution across each transcriptomic region (5′UTR, CDS, 3′UTR and introns) along with aggregate distribution across all regions (‘All’) is shown. Enrichment of UAG motif is seen around cross-link sites. (D) Distribution of polyU motifs (three or more) with respect to cross-link site positions, plotted in a similar fashion to that in panel (C). Enrichment for poly-T stretches is seen around the cross-link sites. (E) Distribution of read density at and around (2 kb up- and downstream) UAG within iCLIP peaks. Red lines indicate UAG sites that are annotated translation stop sites and blue lines denote UAG within iCLIP peaks, and are not denoted to be stop sites.

