. 2019 Aug 27;9(46):26686–26690. doi: 10.1039/c9ra03198g

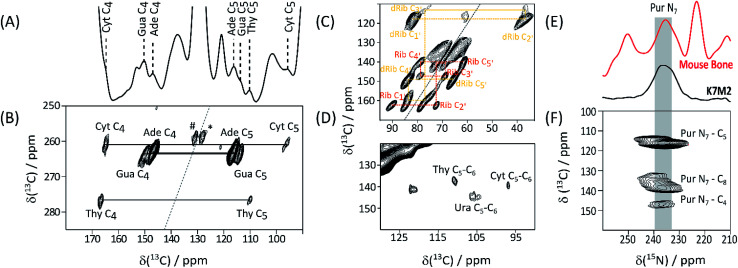
Fig. 2. 13C DNP NMR spectra of Gly*, Glc* supplemented K7M2 ECM. (A) 13C CP-MAS; nucleotide base signals assigned by 2D experiments and database shift values (ESI Schemes S1 and S2) are labelled; (B) high frequency region of INADEQUATE J-transmitted SQ-DQ correlation spectrum (265 ppm 13C DQ sweep width to avoid aliasing; #, * – correlations between lipid olefinic carbons); (C) low frequency region of the same spectrum tracing out correlations within ribose (Rib), and deoxyribose (dRib), rings; (D) high frequency region of the 13C–13C DARR correlation spectrum base; (E) 15N DNP NMR of Gly*Glc* K7M2 ECM compared with that of labelled bone, supporting the assignment of the 235 ppm signal as purine N7; (F) 13C{15N} TEDOR spectrum showing the expected purine N7–C5 and N7–C4, as well as the putative purine ring N7–C8, through-space correlations (15N sweep width 438 ppm to cover full 15N range).

Fig. 2