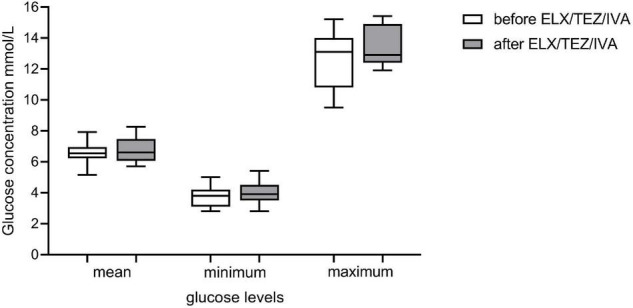
FIGURE 5.

Glucose levels of continuous glucose monitoring (CGM) prior and after initiation of ELX/TEZ/IVA therapy in people with cystic fibrosis. Mean, minimum and maximum glucose levels (mmol/l) of CGM measurements prior (measurements of 2 days) and after (measurements of 5 days) starting ELX/TEZ/IVA therapy. Displayed are boxplots with medium and interquartile range.
