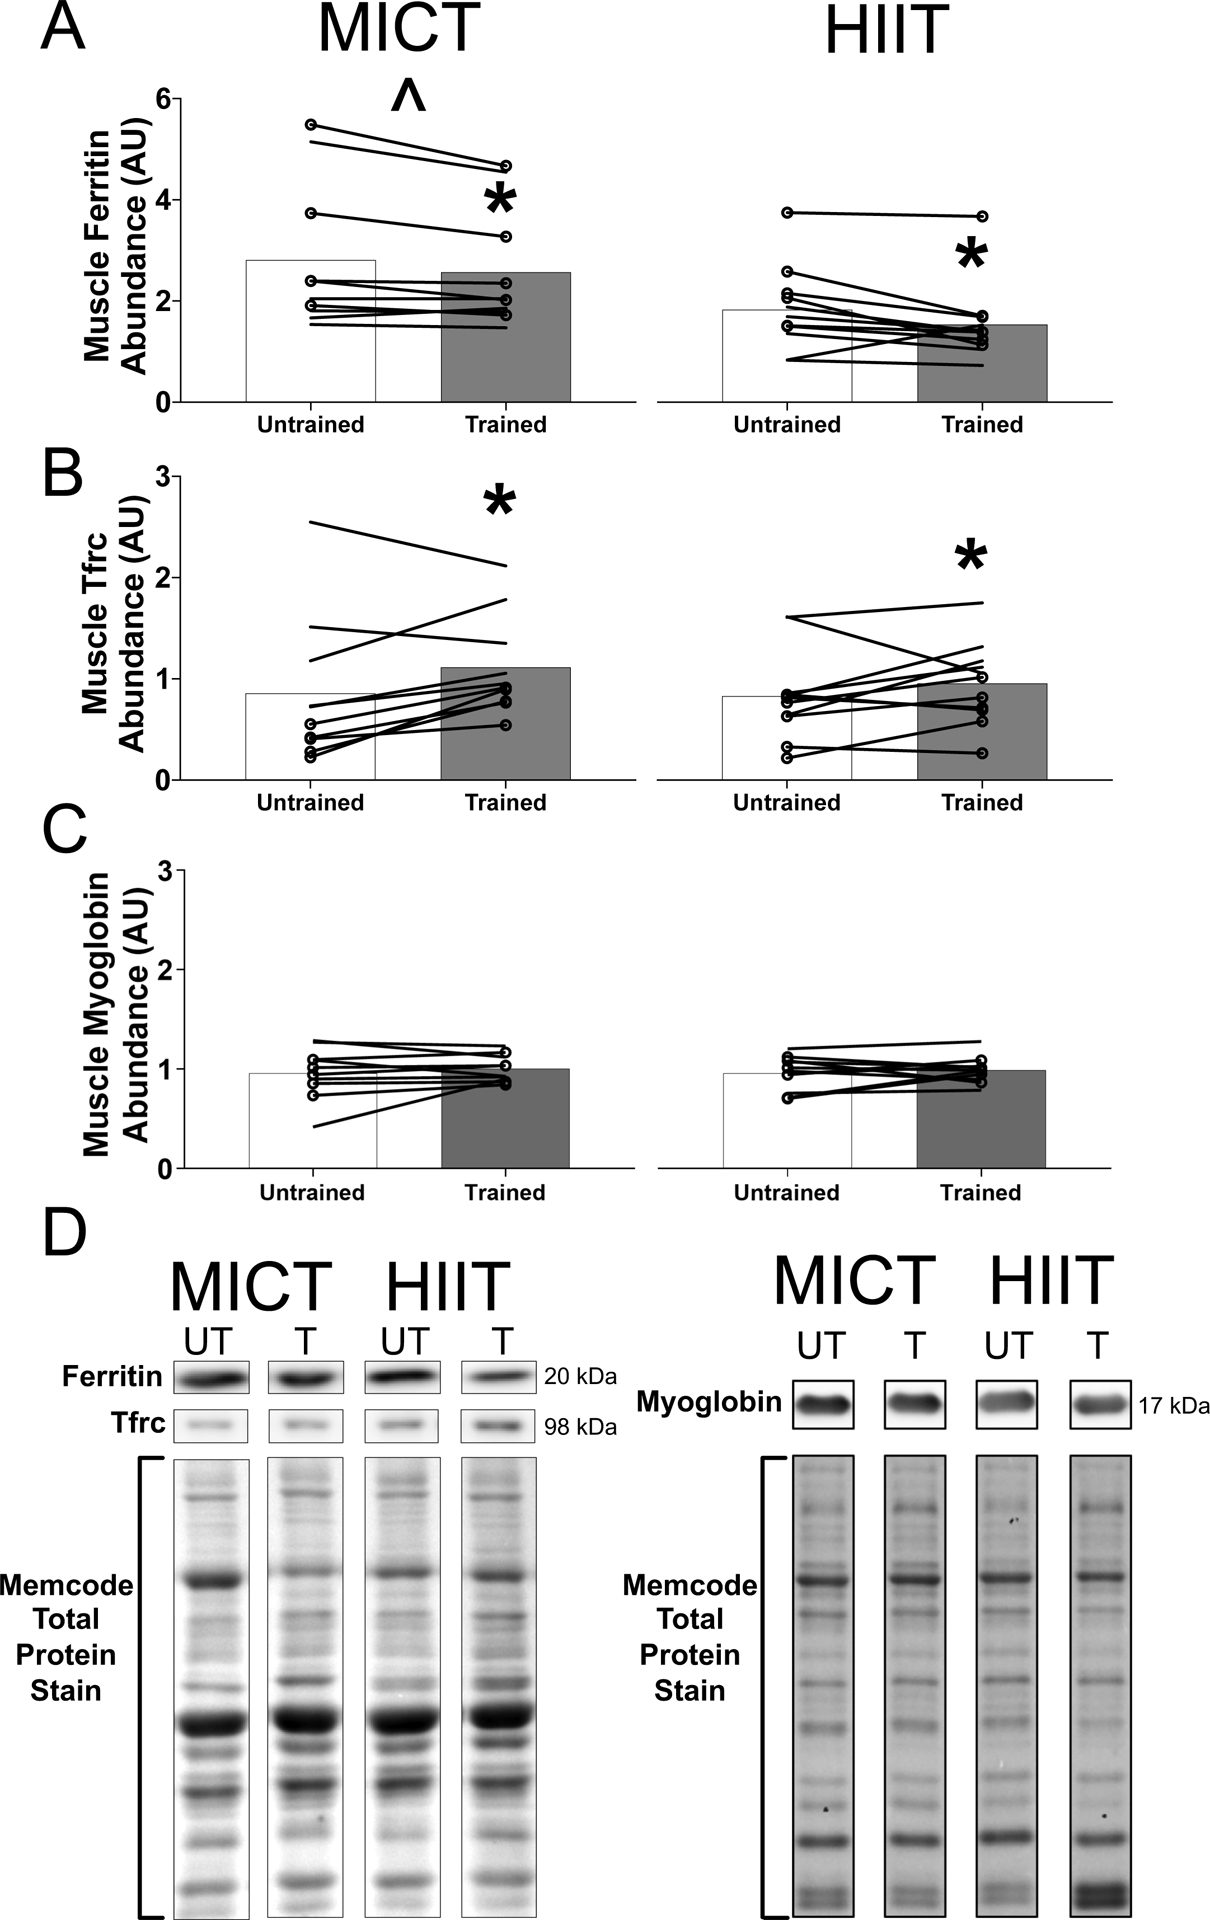
FIGURE 3.

Skeletal muscle iron proteins in response to exercise training. (a–c) Skeletal muscle protein abundance of ferritin (a), transferrin receptor (TFRC; b) and myoglobin (c) in obese men and women before (untrained) and after (trained) 12 weeks of either moderate-intensity continuous training (MICT, n = 10, left panels) or high-intensity interval training (HIIT, n = 11, right panels). The group means are indicated by bars, with data for individual subjects connected by lines. Women are indicated by lines only, whereas men are indicated with lines and circular markers. (d) Representative western blot images from one MICT and one HIIT participant run on the same blots. The images have been cropped, as indicated by the black outline, for clarity. The Memcode total protein stain from these participants is shown below. Abbrevations: T, trained; UT, untrained. *Significant main effect of training status (untrained vs. trained; P < 0.03). ˆSignificant main effect of group (P = 0.02)
