. 2019 Aug 28;9(46):26927–26941. doi: 10.1039/c9ra04718b

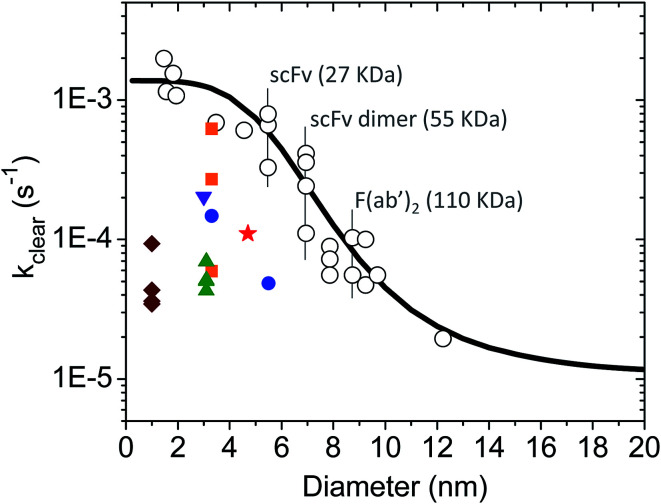
Fig. 2. Single exponential plasma clearance term, kclear, estimated for metal NPs, molecular tracers and protein drugs of different sizes. Open circles: kclear for molecular tracers and proteins; data obtained from ref. 55. The identity of some proteins is shown as example. Solid line calculated with eqn (5). Green triangles: glutathione-coated NPs of different core compositions (entries 1–4 in Table S1). kclear was estimated as CL/Vd using pharmacokinetic data from ref. 38. Blue circles: glutathione- and PEG-coated gold NPs (entries 5–6 in Table S1). kclear was estimated as [C0]/AUC using data from ref. 28. Brown diamonds: atomically precise glutathione-coated gold NPs (entries 7–10 in Table S1). kclear was estimated as CL/Vd using data from ref. 42. Orange squares: glutathione-coated gold NPs administered under different doses (entries 14–16 in Table S1). kclear was estimated as CL/Vd using data from ref. 18. Purple inverted triangle: glutathione-coated gold NPs (entry 17 in Table S1). kclear was estimated as [C0]/AUC using data from ref. 57. Red star: PEG/MBA-coated gold NP. kclear was estimated as [C0]/AUC using data from ref. 58.

Fig. 2