. 2019 Aug 28;9(46):26927–26941. doi: 10.1039/c9ra04718b

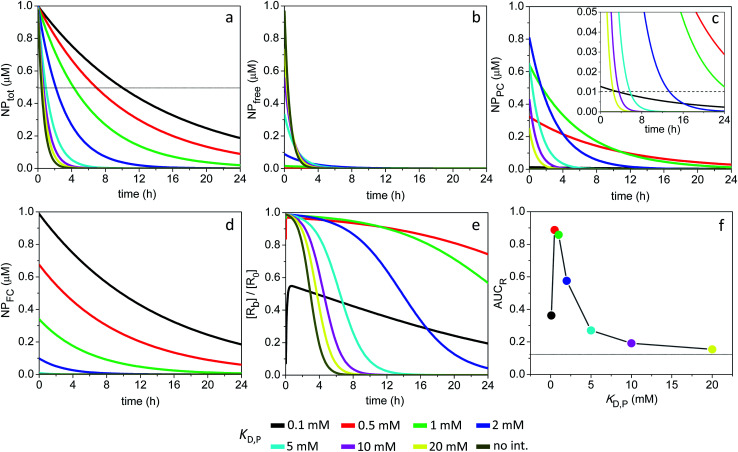
Fig. 3. Time course of NPtot, NPfree, NPPC and NPFC and extent of receptor occupancy assuming the model parameters in Sim #1. (a) Time course of NPtot. The apparent clearance half-life associated with each KD,P is given by the intercept of the thin line with each corresponding decay curve. (b) Time course of NPfree. (c) Time course of NPPC. Dashed line in the inset marks the point where [NPPC] = KD,R. For KD,P = 0.5 and 1.0 mM, [NPPC] > KD,R over the entire 24 h time window. (d) Time course of NPFC. (e) Receptor occupancy as a function of time. (f) Area under the curve for receptor occupancy as a function of KD,P; calculated from (e) with eqn (7). Thin line marks the calculated value of AUCR (0.12) in the absence of soft interactions.

Fig. 3