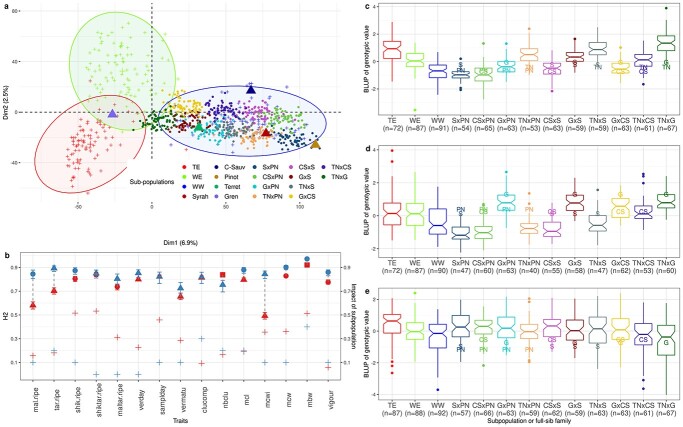
Figure 1.
Description of the half-diallel, relative to the diversity panel. a: PCA of the diversity panel based on 32 894 SNPs with the 3 sub-populations distinguished by different colors, on which half-diallel progenies (dots) and parents (triangles) were projected. b: Broad-sense heritability estimates in the whole half-diallel (red) and in the diversity panel (blue) for the 15 traits studied (left axis), with shape corresponding to the transformation applied to raw data; the relative variance due to the cross effect and the coefficient of determination of the subpopulation effect, for the half-diallel (red) and the diversity panel (blue), respectively, are also reported with “+” (right axis). c, d, e: genotypic value BLUP distribution in each subpopulation or progeny, for mean berry weight, mean cluster width and vigour, respectively; BLUPs for parents are indicated by their initial letters (Table S4). Number of genotypes per subpopulation/progeny is indicated below the subpopulation/progeny name. These traits were chosen to represent various levels of H2 and relative importance of cross effect. BLUP distributions for all traits are presented in Figure S3.

