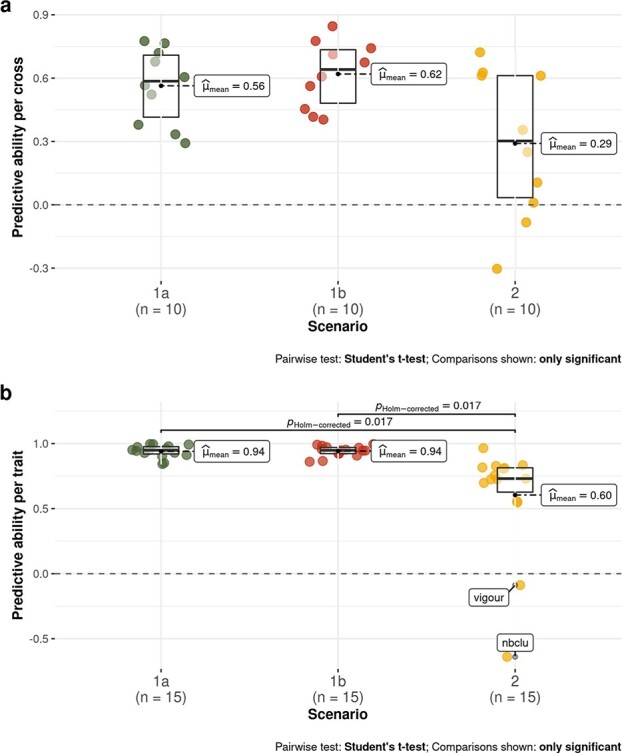
Figure 3.

Boxplots of PA values for the three scenarios (1a: within whole half-diallel prediction; 1b: half-sib prediction within half-diallel; 2: across-population prediction with diversity panel as training set and each half-diallel cross as validation set). Each PA value was the best one obtained between RR and LASSO methods. Average PA is indicated next to each boxplot. a: per-cross PA, b: per-trait PA. Per-cross PA corresponds to the Pearson’s correlation between observed and predicted family mean, over the 10 crosses. Similarly, per-trait PA was calculated over the 15 traits.
