
Figure 2.
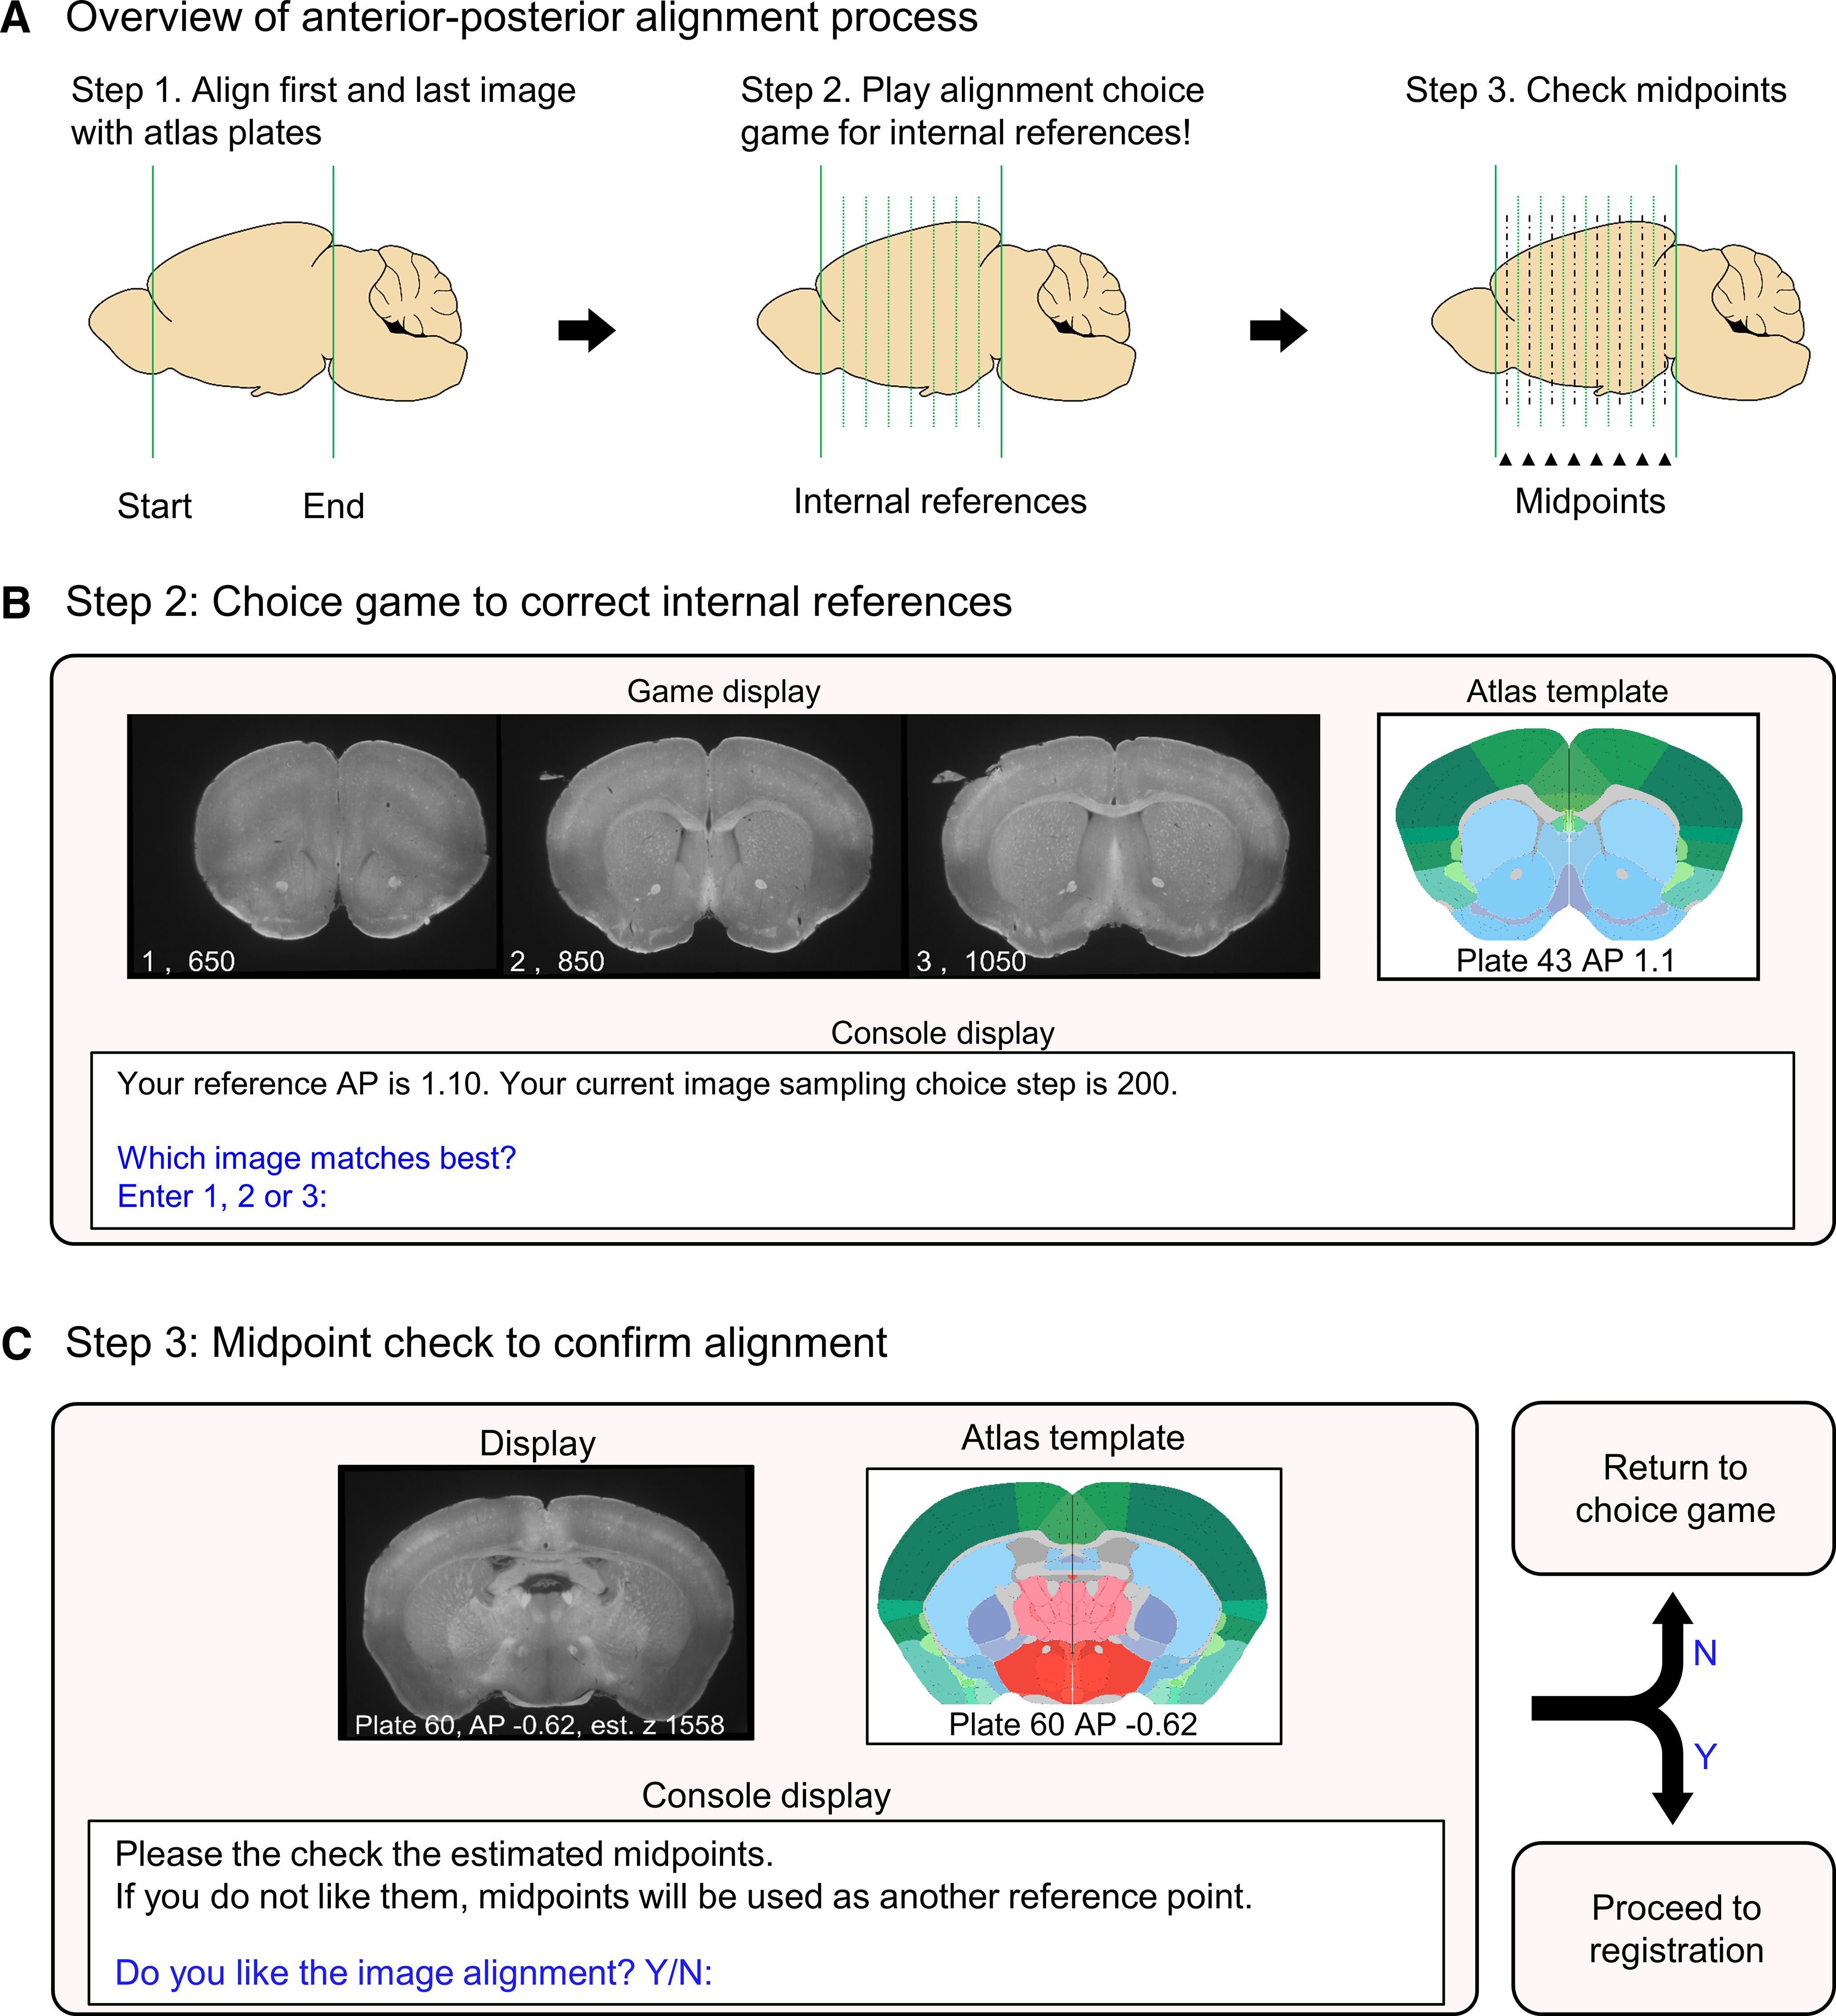
Diagram of the alignment process to reference templates. A, A schematic illustrating the process of qualitative alignment and inspection of midpoints of reference templates. B, A visual representation of the graphical windows displayed during the choice game and the user options allowed in the R console window. The choice game is cycled through each internal reference template. During the midpoint check, the choice game is automatically played again for midpoints that are unsatisfactorily aligned; these midpoints become additional reference templates. C, A visual representation of the graphical windows displayed during the qualitative midpoint check and the user options in the R console.