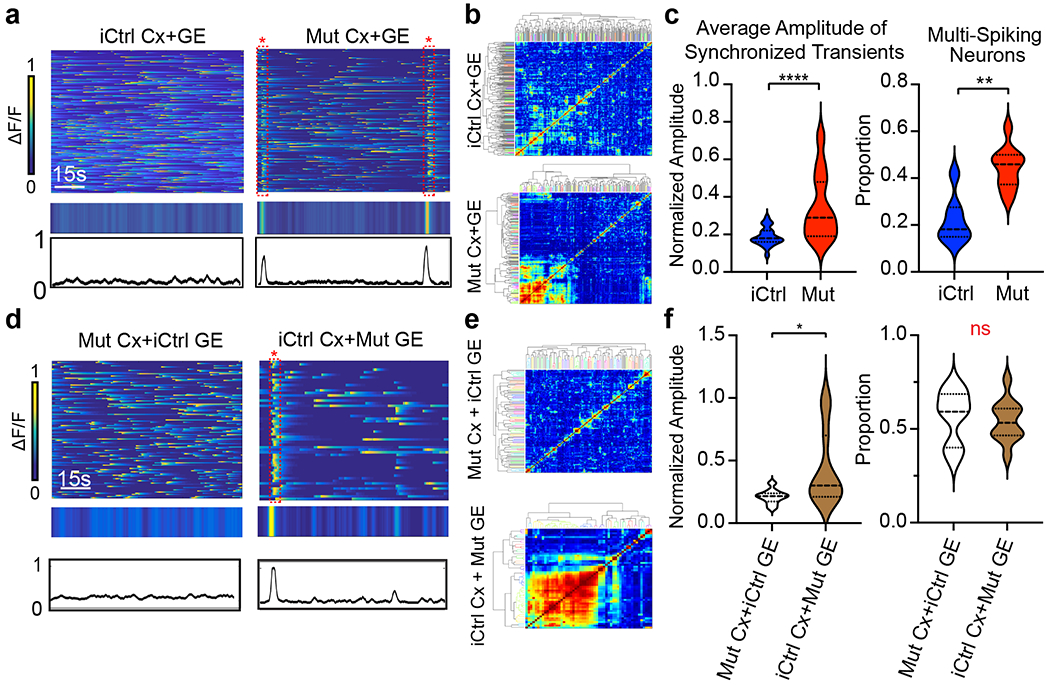
Fig. 6 |. Rett syndrome fusion organoids display GE dependent hypersynchronous neural network activity.

a, Mut Cx+GE fusions exhibit spontaneous synchronized Ca2+ transients that are not seen in iCtrl Cx+GE, reflected in the raw ΔF/F colorized amplitude plot (top), synchronization amplitude plot (bottom), and clustergram b. c, Pooled data quantifications, n = 12 independently generated iCtrl and n = 7 independently generated Mut fusion organoids, ****P < 0.0001 for the average amplitude of synchronized transients; **P = 0.0012 for multi-spiking neurons, significance assessed by two-sided Mann-Whitney U. d, Mixed fusions with iCtrl Cx and Mut GE exhibit spontaneously synchronized calcium transients, whereas as mixed fusions with Mut Cx and iCtrl GE do not, as seen in the raw ΔF/F colorized amplitude plot (top), synchronization amplitude plot (middle), and clustergram e. f, Pooled data quantifications, n = 10 independently generated iCtrl Cx+Mut GE and n = 11 Mut Cx+iCtrl GE, *P =0.0308, DF = 19, t = 2.334, two tailed student’s t-test. Plots in c,f display the full distribution of individual data points with dotted lines to indicate the median and quartile values.
