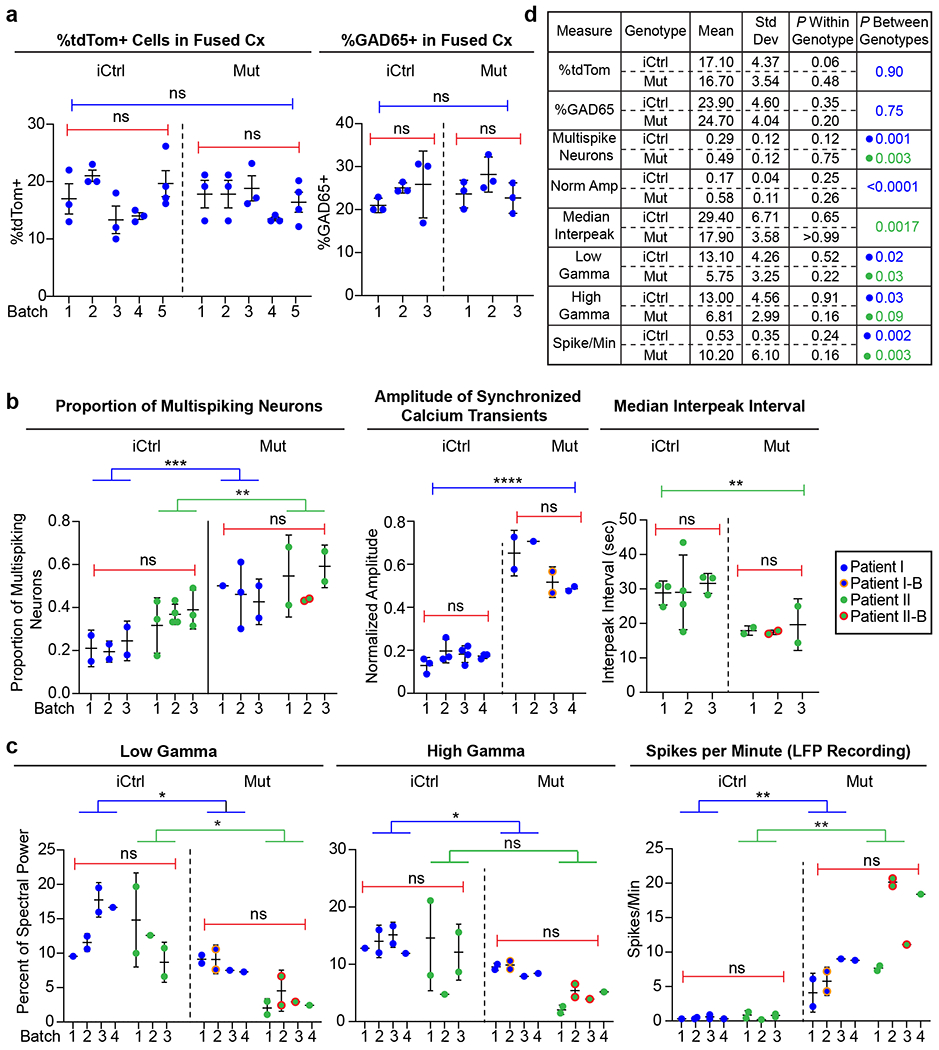
Extended Data Fig. 1. Plots and table of batch and patient line variability for key experimental measures.

a, Plots of experimental results from different batches of iCtrl and Mut Cx+GE fusion organoids analyzed for the percentage of cells in the cortical compartment that expressed tdTomato (tdTom) after the GE portion was labeled with AAV1-CAG:tdTom virus (left panel) or GAD65 antibodies (right panel). Each dot represents an individual organoid section used for analysis and numbered elements on the x-axis represent individual experiments. No significant within or across genotype differences were noted for either percentage of Cx expressing tdTom or GAD65. b,c, Plots of individual experimental results from iCtrl and Mut Cx+GE fusion calcium indicator and LFP experiments. Each dot represents results from an independent experiment, numbered elements on the x-axis represent independent organoid batches. Blue dots represent hiPSC line I (Rett patient with a 705delG frameshift mutation), green dots represent hiPSC line II (Rett patient with 1461A>G missense mutation), and orange and red circles indicate independently isolated hiPSC lines from the same patient. For calcium indicator and LFP data, plots were generated for all experiments in which significant differences between Mut and iCtrl Cx+GE fusions were reported. In all cases in which the same measure resulted in statistically significant differences between Mut and iCtrl in both hiPSC patient lines, the two patient lines were combined for within genotype statistical analyses (e.g., proportion of multispiking neurons). d, Table with mean, standard deviation (Std Dev), within genotype P value, and between genotype P value for all measures shown in a-c. The results show relatively low Std Dev within genotypes as reflected in non-significant P values, yet highly significant differences between the iCtrl and Mut groups in nearly all functional measurements. All between batch statistical analyses were by ANOVA. All between genotype analyses by ANOVA with correction for multiple comparisons by Tukey’s test, unless otherwise specified in the main text.
