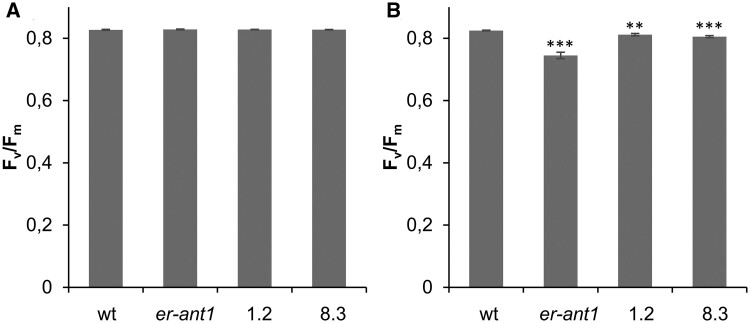
Figure 2.
Maximum quantum yield of PSII (Fv/Fm) of wt, er-ant1, and two selected M3 ser-ant1 plants. A, Fv/Fm at 2,000 parts per million (ppm) CO2. B, Fv/Fm at ambient air. Data represent mean values of seven individual replicates, ±se. Asterisks indicate the significance level between wt and mutant plants according to a Student’s t test (**P < 0.01, ***P < 0.001).

