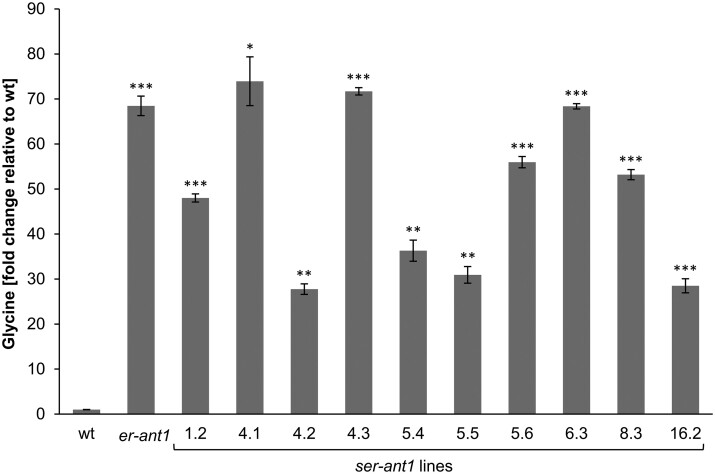
Figure 3.
Glycine content of leaves from er-ant1 and ser-ant1 mutants relative to the wt level. Plants were cultivated at ambient CO2 conditions. The glycine content of the wt was set to 1. Data represent mean values of five individual replicates ± se. Asterisks indicate the significance between the glycine levels of wt and mutant plants according to a Student’s t test (*P < 0.05, **P < 0.01, ***P < 0.001).

