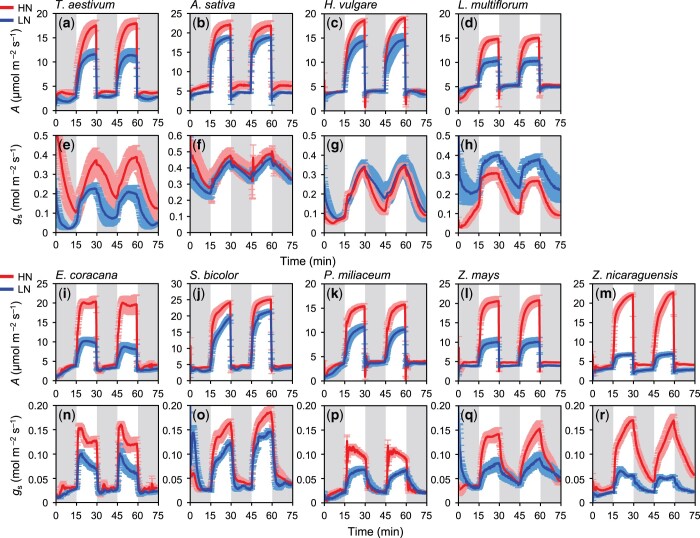
Figure 1.
Dynamics of photosynthetic rate (A) and stomatal conductance (gs) at the leaf level in the controlled fluctuating light environments in four C3 and five C4 species. (A–H) four C3 and (I–R) five C4 species. Light intensity was alternately changed between low (100 μmol m−2 s−1 PPFD, gray area) and high (1,000 μmol m−2 s−1 PPFD, white area) at 15-min intervals for a total of 75 min. Red and blue lines represent plants grown under HN and LN conditions, respectively. Data are the mean ± se (n = 4).

