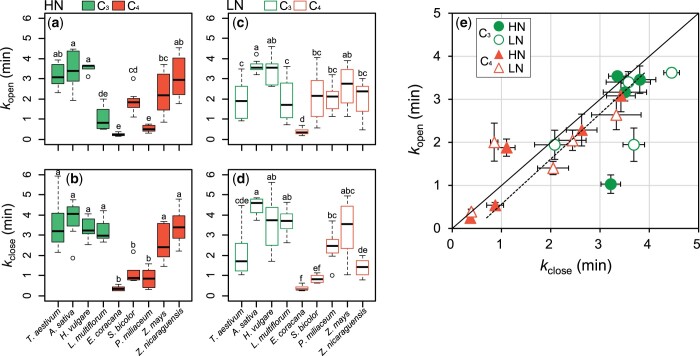
Figure 3.
Time constants for stomatal opening (kopen) and closure (kclose) determined by the photosynthesis measurements in four C3 and five C4 species grown under HN or LN conditions. A–D, Green and orange boxes indicate C3 and C4 species, respectively. Boxplots represent the median (solid black line), first and third quartile (box limits), and maximum and minimum values (whiskers). Significant differences between the species were determined using ANOVA followed by Tukey’s test (P < 0.05) and are indicated by different letters. Data are the mean ± se (n = 4). E, In the relationship between kopen and kclose, solid and dotted lines represent regression line (R2 = 0.66, P < 0.01) and 1:1 line, respectively.

