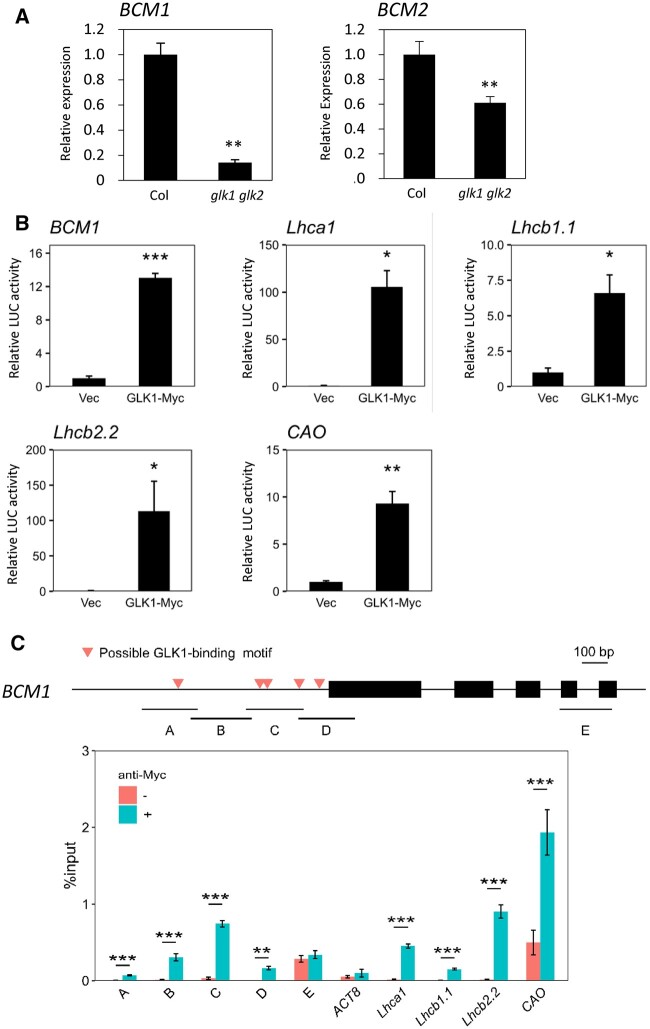
Figure 3.
Direct regulation of BCM1 expression by GLK1. A, RT-qPCR analysis of BCM expression in presenescent leaves of glk1 glk2. **P < 0.01 (n = 4). Seventh to eighth leaves from the top of 25-day-old plants grown at 22°C under short-day conditions were used. B, Transactivation of photosynthesis-related genes by GLK1. Constructs containing luciferase genes driven by promoters of BCM1 and known GLK1-target genes were transiently introduced into Arabidopsis mesophyll protoplasts together with GLK1-4 × MYC constructs (GLK1-Myc). “Vec” represents a control into which the luciferase reporter construct and an empty effector vector were introduced. C, ChIP-qPCR analysis of GLK1 binding to the BCM1 promoter was performed using GLK1-4 × MYC overexpressing plants. The upper panel shows the gene structure of BCM1. Red triangles indicate the positions of possible GLK1-binding sequences. Black boxes represent exons. A–E represent DNA regions used in ChIP-qPCR analysis. The lower panel shows the results of ChIP-qPCR analysis. Fold enrichment is indicated as the % input. ** and ***P < 0.01 and P < 0.001, respectively (Student’s t test).

