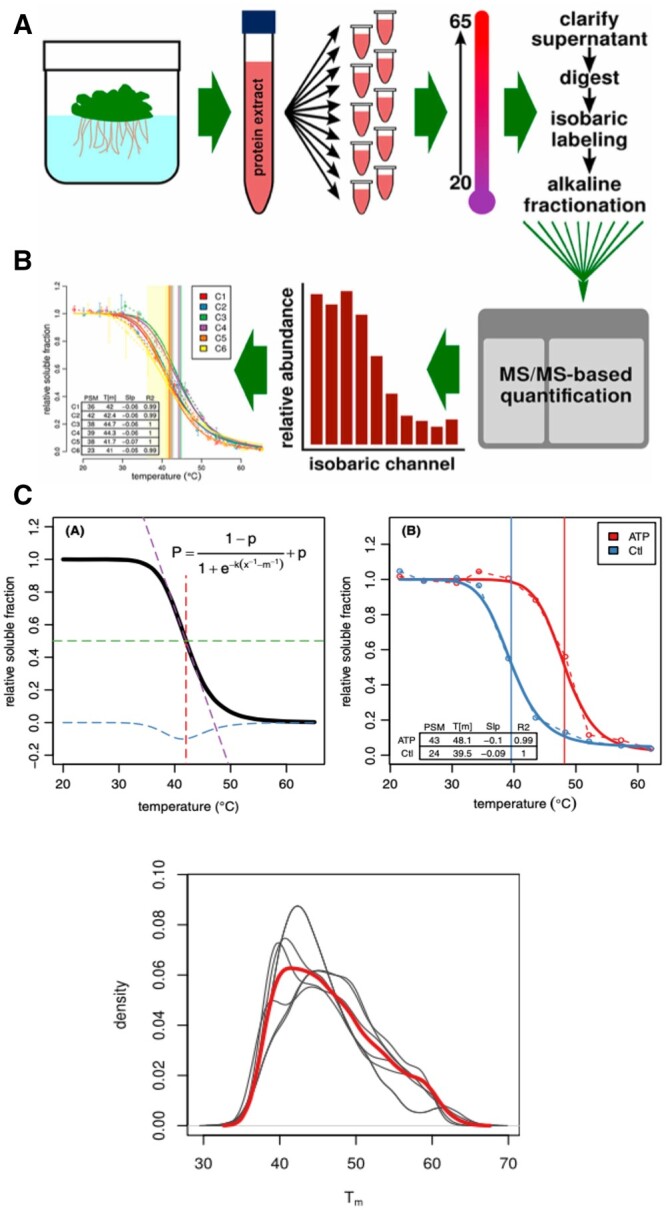
Figure 4.

TPP of A. thaliana crude cell lysates. In (A), a summary of the overall scheme for measuring the thermal denaturation temperature for thousands of proteins in the A. thaliana proteome simultaneously. On the left side of (B) is shown the profile for a model protein, with the equation used to predict the thermal denaturation temperature. On the right of (B) is shown experimental data for one protein after lysate is treated with or without MgATP. The increased Tm denotes an increase in stability and thermal denaturation temperature required to unfold a protein after its ligand (here, MgATP) is bound to the protein. In (C), the overall TPP temperatures for thousands of proteins isolated from plants grown under varying conditions. Data, figures, abbreviations, and units of measurement in figures are taken from Volkening et al. (2019).
