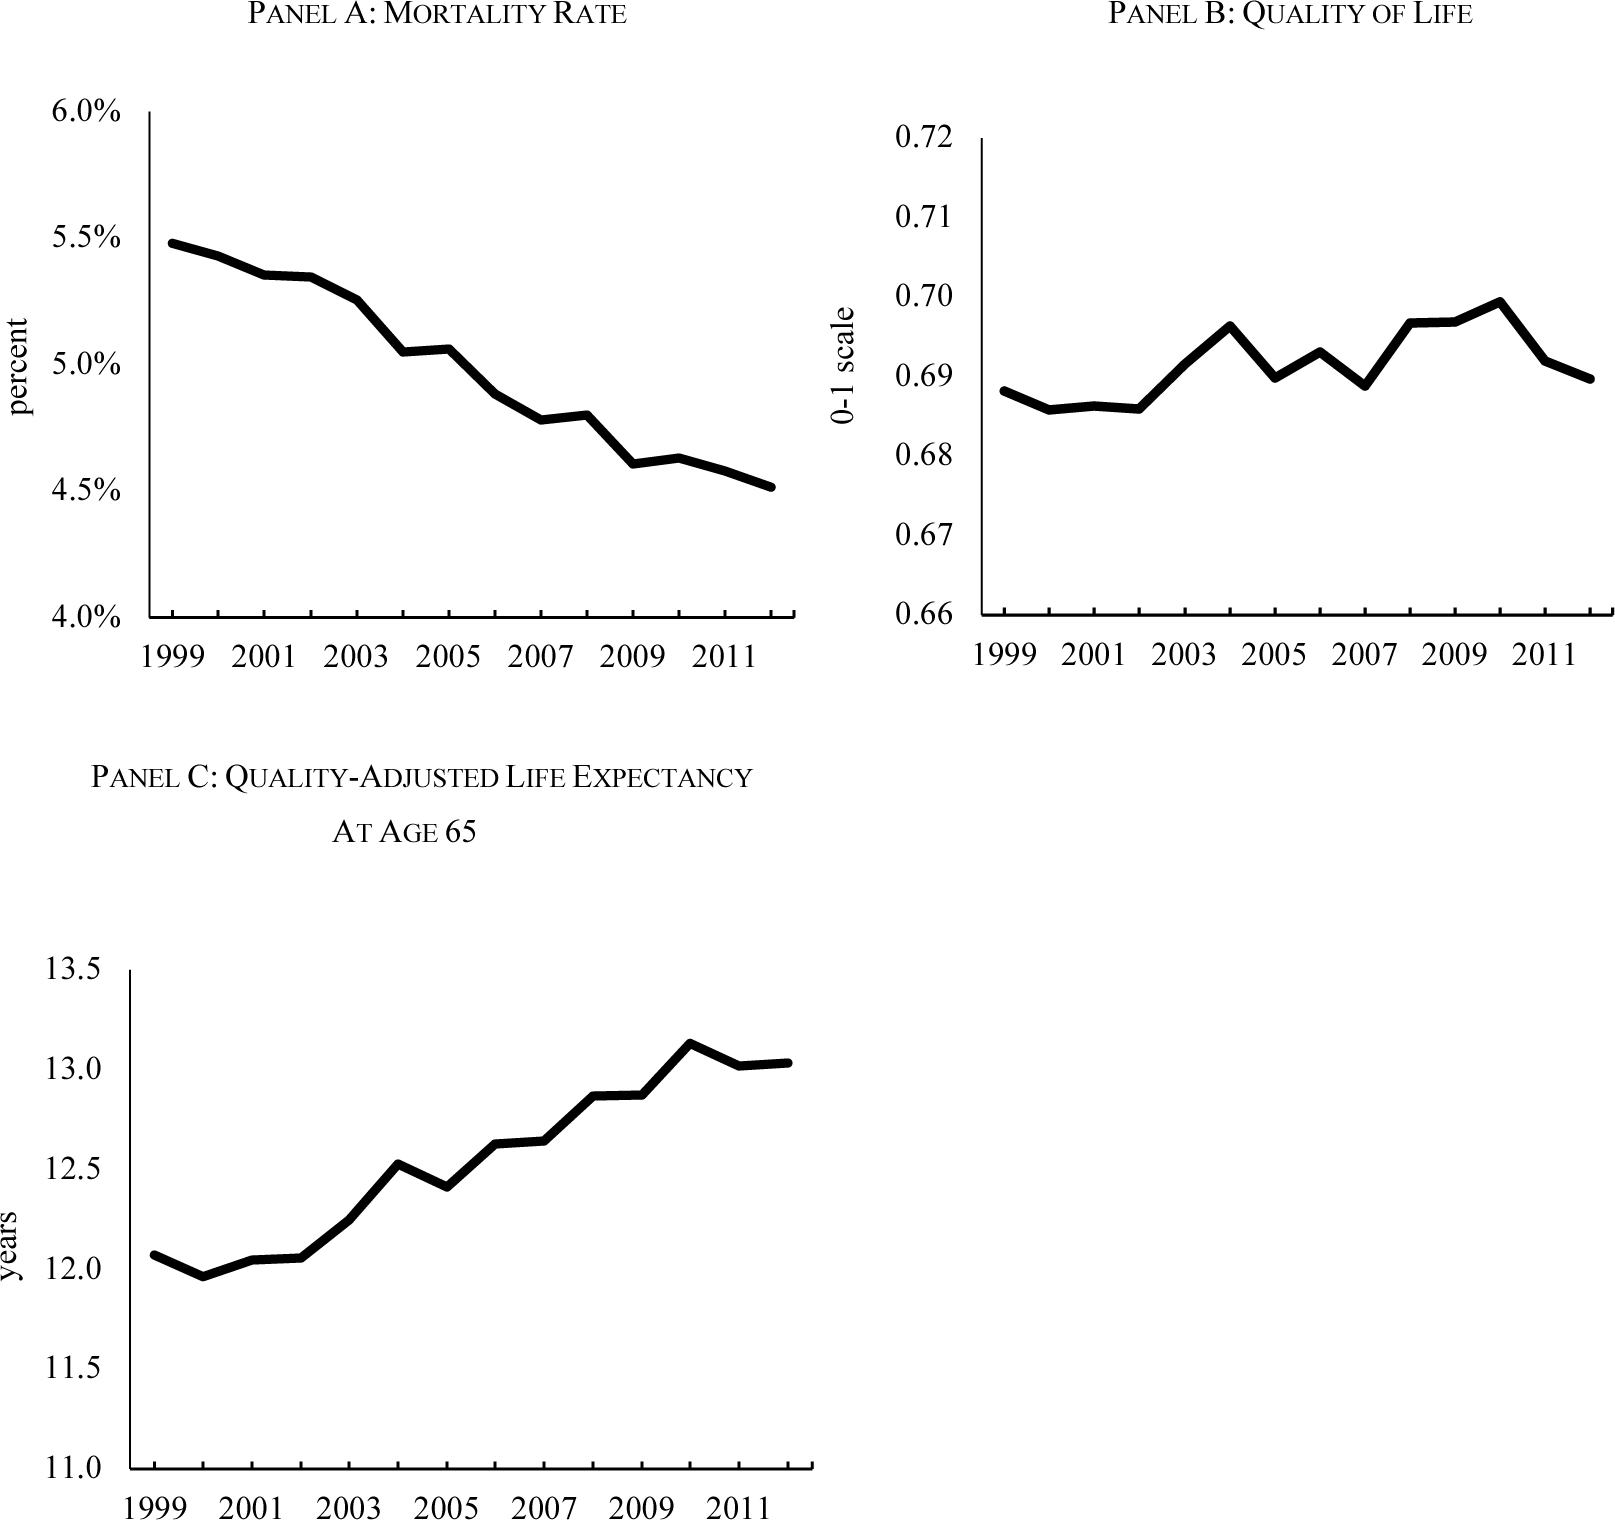
FIGURE 3. MEASURES OF HEALTH IN THE ELDERLY POPULATION, 1999–2012.

Notes: Mortality rates and quality of life in charts (a) and (b) are age-adjusted to the 2010 population, using data on population shares aged 65–74, 75–84, and 85+. Mortality rates are from Vital Statistics. Quality of life disutilities are based on a regression model relating self-rated health on a 0–100 scale in MEPS 2000–2002 to measures of ADL impairments, IADL impairments, functional limitations, sensory problems, and whether health limits social activities. These impairments are available in the MCBS each year from 1999–2012. Weights are assumed to be constant over time. Quality-adjusted life expectancy is the expectation of quality-adjusted years of life remaining, using age- and year-specific mortality and quality of life weights.
Source: MEPS and MCBS, with mortality rates matched to national totals.
