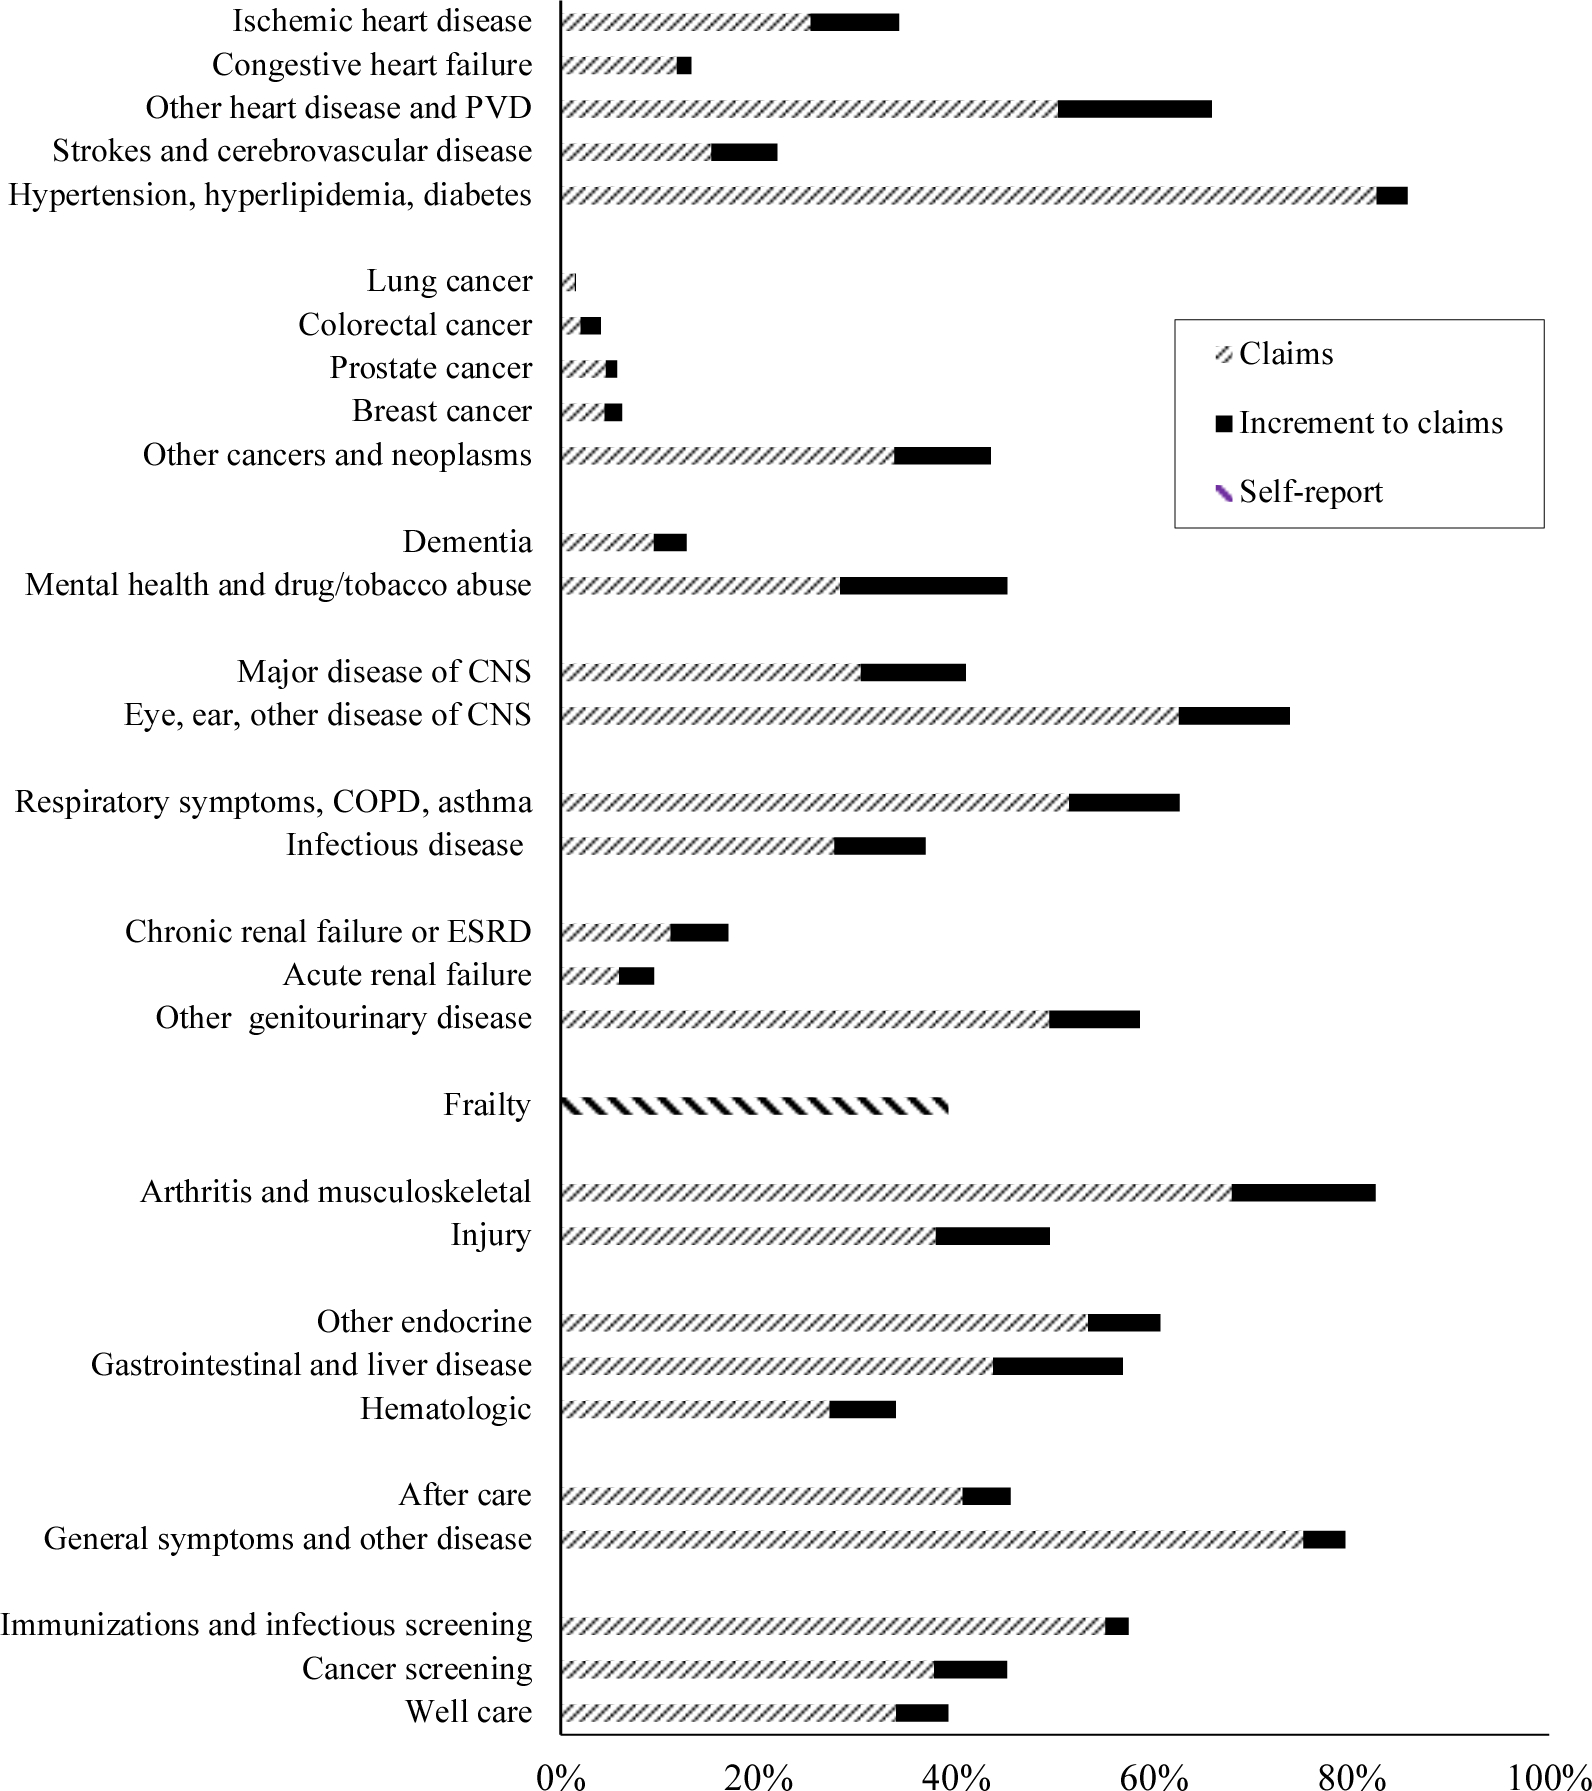
FIGURE 4. CONDITIONS AND PREVALENCE RATES, 2012.

Notes: The figure shows the prevalence of different conditions in the elderly population in 2012. Except for frailty, each condition has two parts: the prevalence as measured by claims, and the additional prevalence added via calibration to prevalence in the NHANES. Frailty is based on self-reports of frailty in MCBS. Data are weighted using population weights. CNS = Central nervous system; COPD = Chronic obstructive pulmonary disease; ESRD = End-stage renal disease; ID = Infectious disease.
Sources: MCBS matched to NHANES prevalence.
