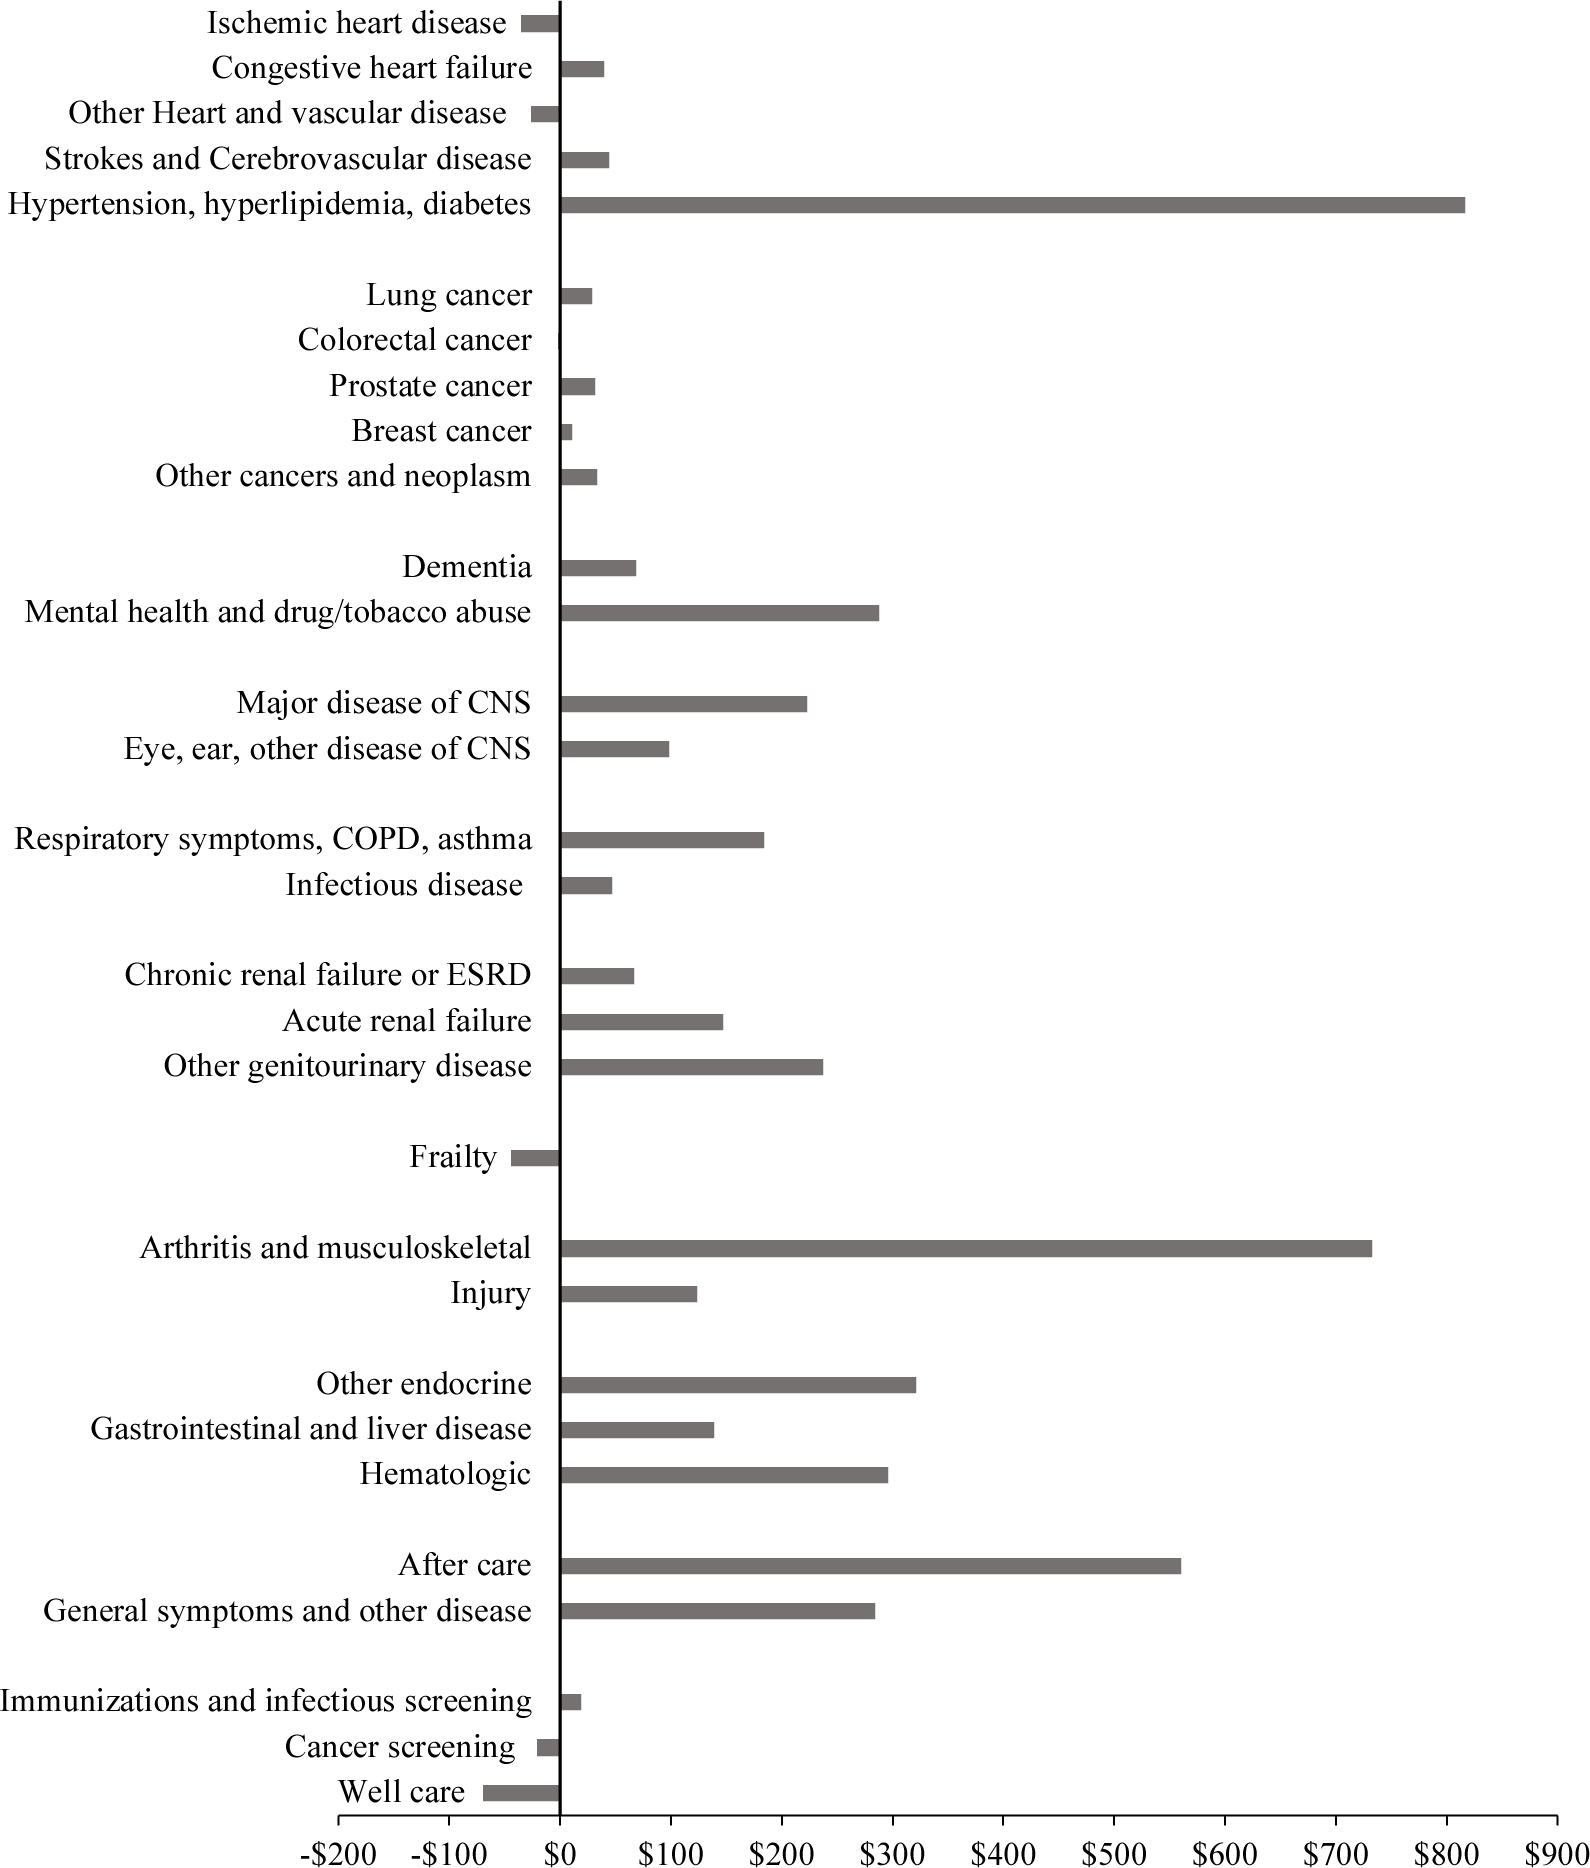
FIGURE 7. CHANGE IN PER CAPITA MEDICAL SPENDING BY CONDITION, 1999–2012.

Notes: Per capita spending is spending per person with the disease multiplied by the disease prevalence rate. Spending is in real ($2010) dollars.
Source: Data are from the Medicare Current Beneficiary Survey, adjusted so that total spending matches national estimates of spending on the elderly.
