
FIGURE 8. CHANGE IN QALE BY CONDITION, 1999–2012.
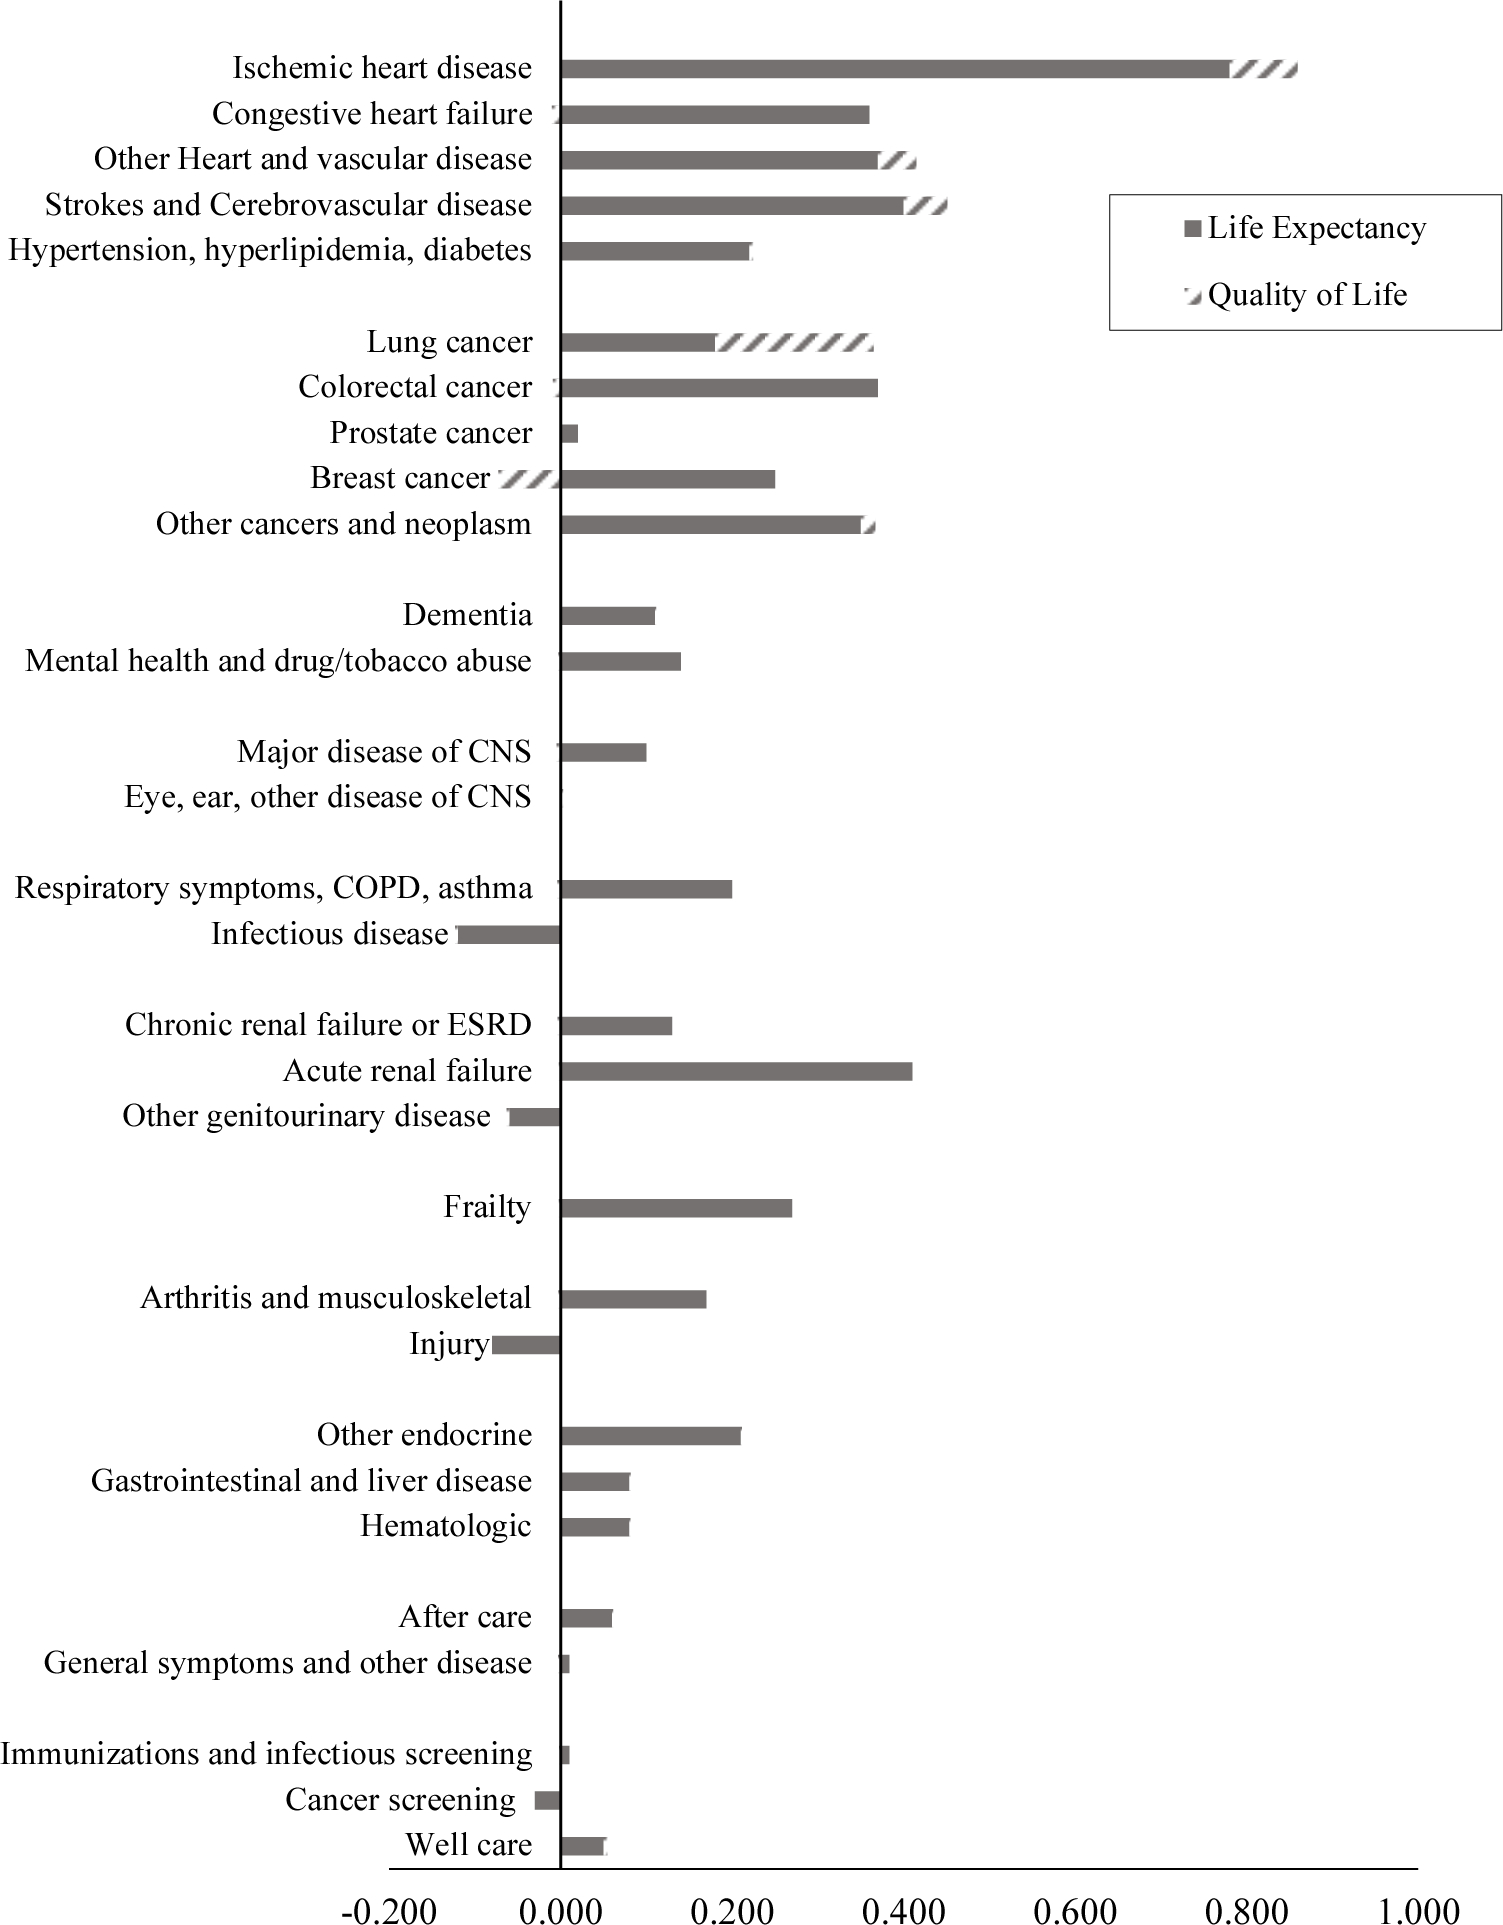
Notes: QALE is as of age 65. Mortality data are disaggregated from national totals to conditions. Quality of life is based on survey responses about symptoms and impairments. Disutility weights are based on analysis of the MEPS.
Sources: Authors’ calculations based on MCBS and MEPS.