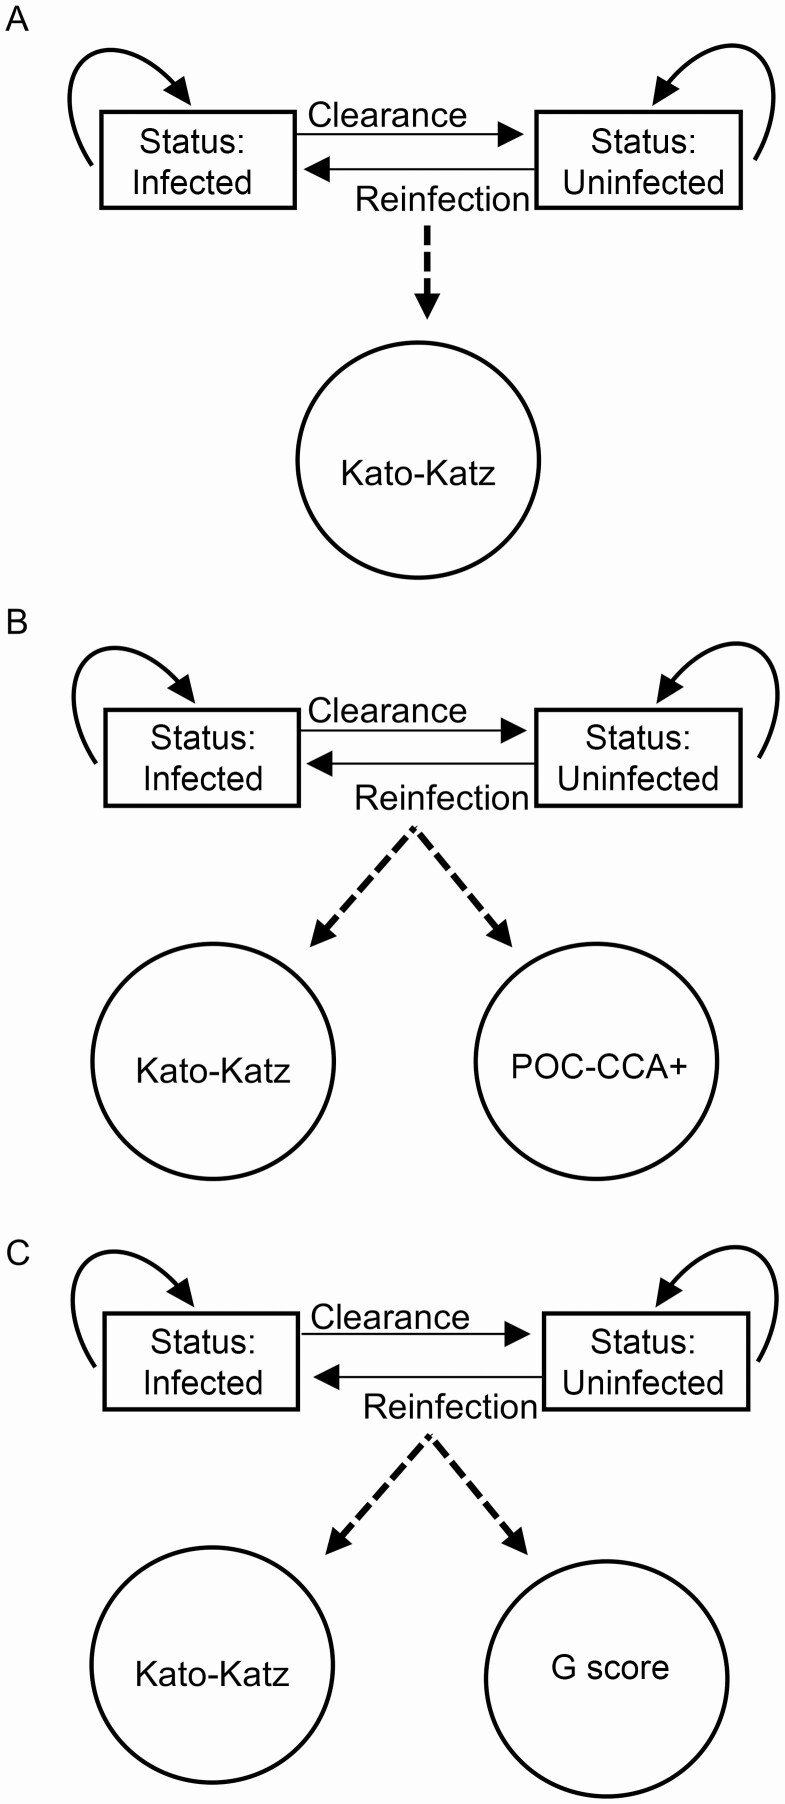
Figure 1.
The 3 parameterizations of the hidden Markov model framework. Rectangles represent biological processes that are unobserved and give rise (dotted lines) to the observable processes in circles (ie, diagnostic data). Solid arrows indicate the direction of movement between time steps: remain infected, remain uninfected, become uninfected (clearance), or become infected after clearance (reinfection). A, Kato-Katz data only. B, Kato-Katz and POC-CCA+ data. C, Kato-Katz and G-score data.

