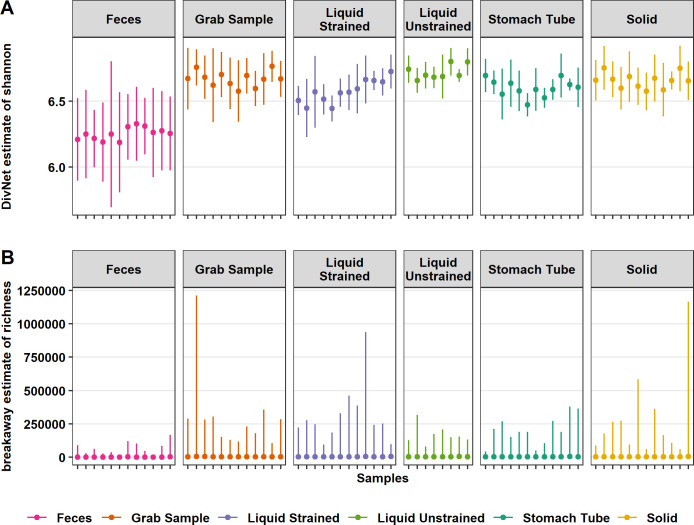
Fig 2. Differences in estimated alpha diversity among sample types.
(A) DivNet estimate of Shannon diversity plotted as mean with 95% confidence intervals and (B) mean breakaway estimate of species richness with 95% confidence intervals. The x-axis ticks represent samples from each cow on different days. Both the richness and evenness of fecal samples were lower than all other rumen sample types (P ≤ 0.001). Stomach tube and liquid strained samples had lower evenness than grab samples (P ≤ 0.001). Solid and stomach tube samples were estimated to have fewer species than grab samples (P = 0.02 and P ≤ 0.001, respectively).

