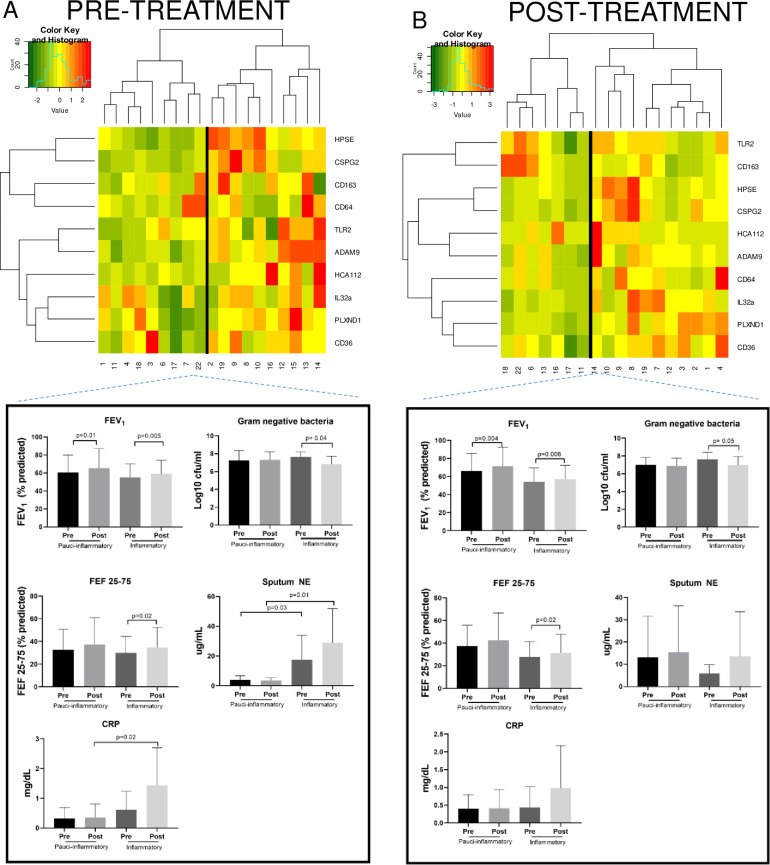
Fig 5. Dendrogram, heat map, and clinical characteristics for hierarchical clustering based on panel expression pre and post treatment.
(A) The pre-treatment dendrogram only includes gene expression values prior to AZLI treatment and (B) the post-treatment dendrogram only includes gene expression values following AZLI treatment. Each column represents an individual patient and each row represents a single gene. For each dendrogram, subject IDs are depicted below each column, so that changes from pre- to post-treatment endpoints for each subject can be visualized. Expression of genes for each subject is depicted with a color-coded histogram representing level of gene expression on a natural log scale. Green signifies reduced gene expression; red indicates increased expression. Clusters are labeled “Pauci-inflammatory” or “Inflammatory” based on the degree of gene expression for pre and post-AZLI time points. The clinical characteristics of subjects in each cluster before and after inhaled AZLI are represented in the figures below each dendrogram to include ppFEV1, ppFEF25-75, gram negative bacterial density (log10 CFU/mL), sputum neutrophil elastase (μg/mL), each of which are evaluated by two sample t-tests. Bars represent mean values and error bars represent SDs on the same scale as means.

