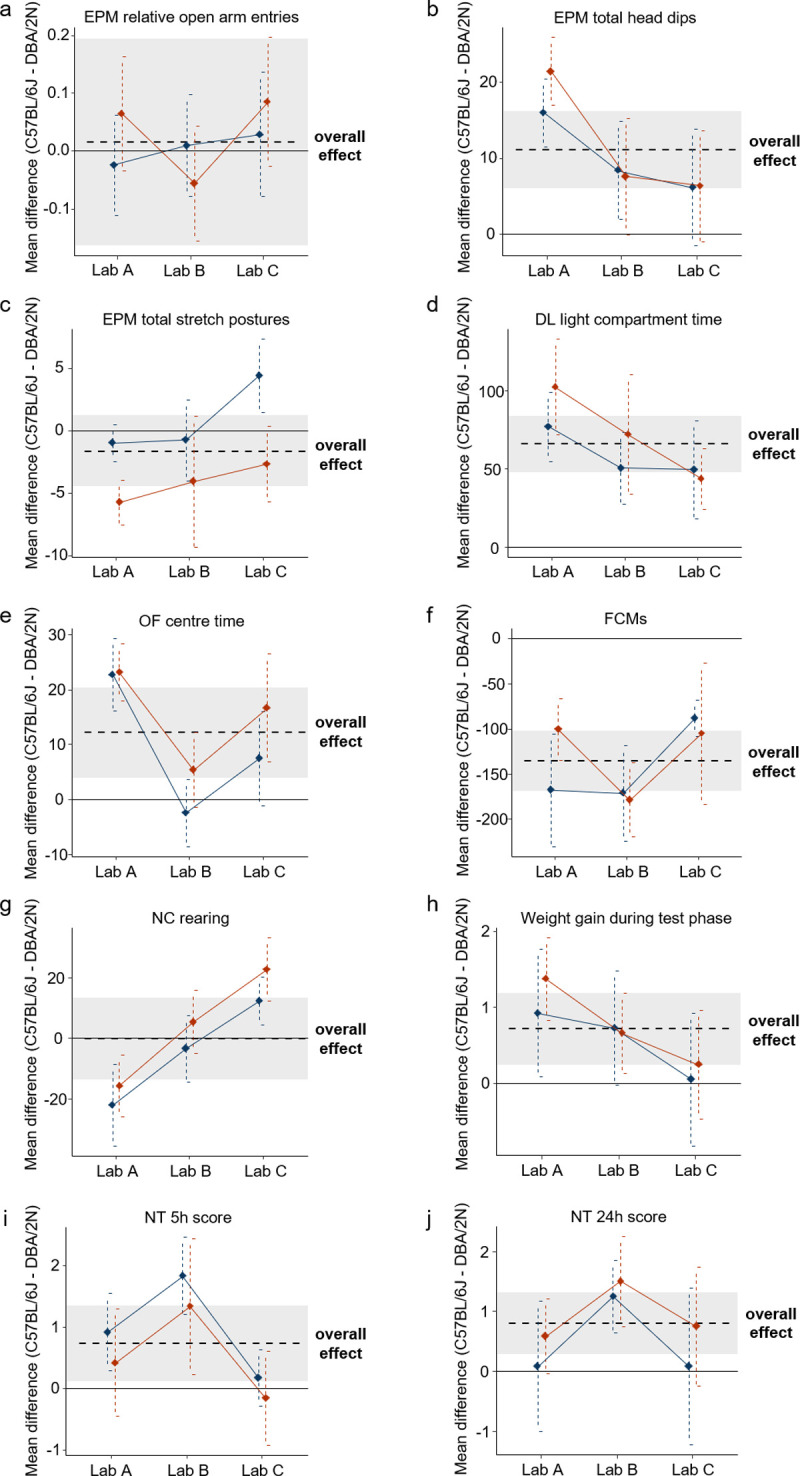
Fig 2. Variation of mean strain differences across the 3 laboratories in the standardised (red) and the heterogenised design (blue).

Shown are the mean strain differences of C57BL/6J and DBA/2N mice in the order of testing in (a) “relative open arm entries in the EPM” (b) “total head dips in the EPM” (c) “total stretched postures in the EPM” (d) “light compartment time in the DL test” (e) “OF centre time” (f) “FCMs concentrations” (g) “amount of rearings in the NC test” (h) “weight gain during test phase” (i) “NT test score after 5 h” and (j) “NT test score after 24 h”. The black dashed line and the shaded area indicate the overall mean strain difference of this outcome measure and its corresponding CI95. The black solid line reflects a null effect. Dots and vertical dashed lines reflect the mean strain differences and corresponding CI95 of the results from the 3 laboratories in each design. The raw data underlying this figure are available in the Figshare repository https://figshare.com/s/f327175aa8b541ef01bd. CI95, 95% confidence interval; DL, Dark Light; EPM, Elevated Plus Maze; FCMs, faecal corticosterone metabolites; NC, Novel Cage; NT, Nest; OF, Open Field.
