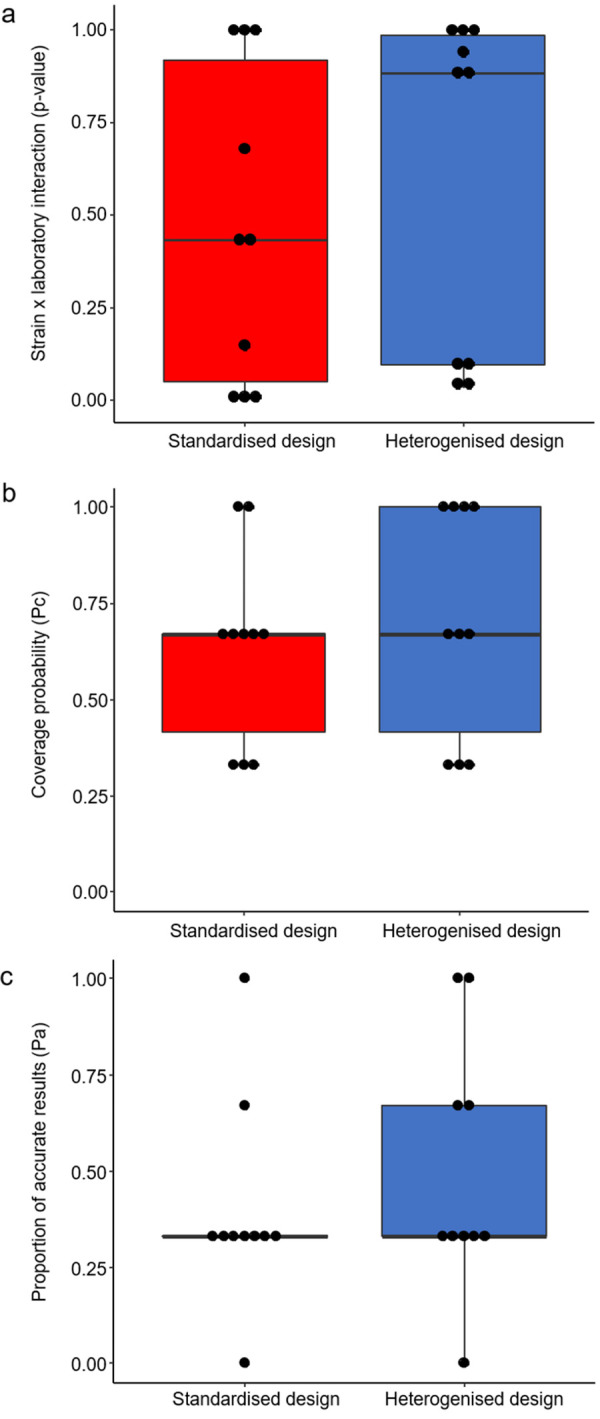
Fig 3.

Comparison of the reproducibility of the strain effect across different laboratories between a standardised (red) and heterogenised design (blue). Shown are the following measurements of reproducibility: (a) Consistency of the strain effect across the 3 laboratories. This measurement is reflected by the p-value of the “strain-by-laboratory” interaction term of all 10 outcome measures. (b) Pc of all 10 outcome measures and (c) Pa of all 10 outcome measures. Data are presented as boxplots showing medians, 25% and 75% percentiles, and 5% and 95% percentiles. Black dots represent single values for each outcome measure in both designs. Statistics: Wilcoxon signed-rank test (paired, one-tailed, n = 10). The raw and processed data underlying this figure are available in the Figshare repositories https://figshare.com/s/f327175aa8b541ef01bd and https://figshare.com/s/2245cee43a544ee1ffff. Pa, proportion of accurate results; Pc, coverage probability.
